Les moyennes mobiles à tendance supérieure
Auteur:ChaoZhang est là., Date: le 23 mai 2022 à 16h49Les étiquettes:SMALe taux d'intérêtLa WMALe DEMATMAATR
l'ajout de 100 périodes de moyenne mobile exponentielle dans le calcul de la SuperTrend et aussi de 0,5 ATR Multiplier pour avoir une vue claire de la tendance en cours et fournit également des supports et des résistances significatifs.
Le type de moyenne mobile par défaut est défini comme EMA (moyenne mobile exponentielle), mais les utilisateurs peuvent choisir parmi 11 types de moyennes mobiles différents:
SMA: moyenne mobile simple EMA: Moyenne mobile exponentielle WMA: moyenne mobile pondérée DEMA: moyenne mobile exponentielle double TMA: moyenne mobile triangulaire VAR: Indice variable Moyenne mobile dynamique aussi appelée VIDYA WWMA: La moyenne mobile de Welles Wilder ZLEMA: Moyenne mobile exponentielle à retard zéro TSF: La vraie force de la force HULL: Moyenne mobile de la coque TILL: Moyenne mobile T3 de Tillson
Félicitations à @CryptoErge pour avoir partagé son développement avec le public.
test de retour
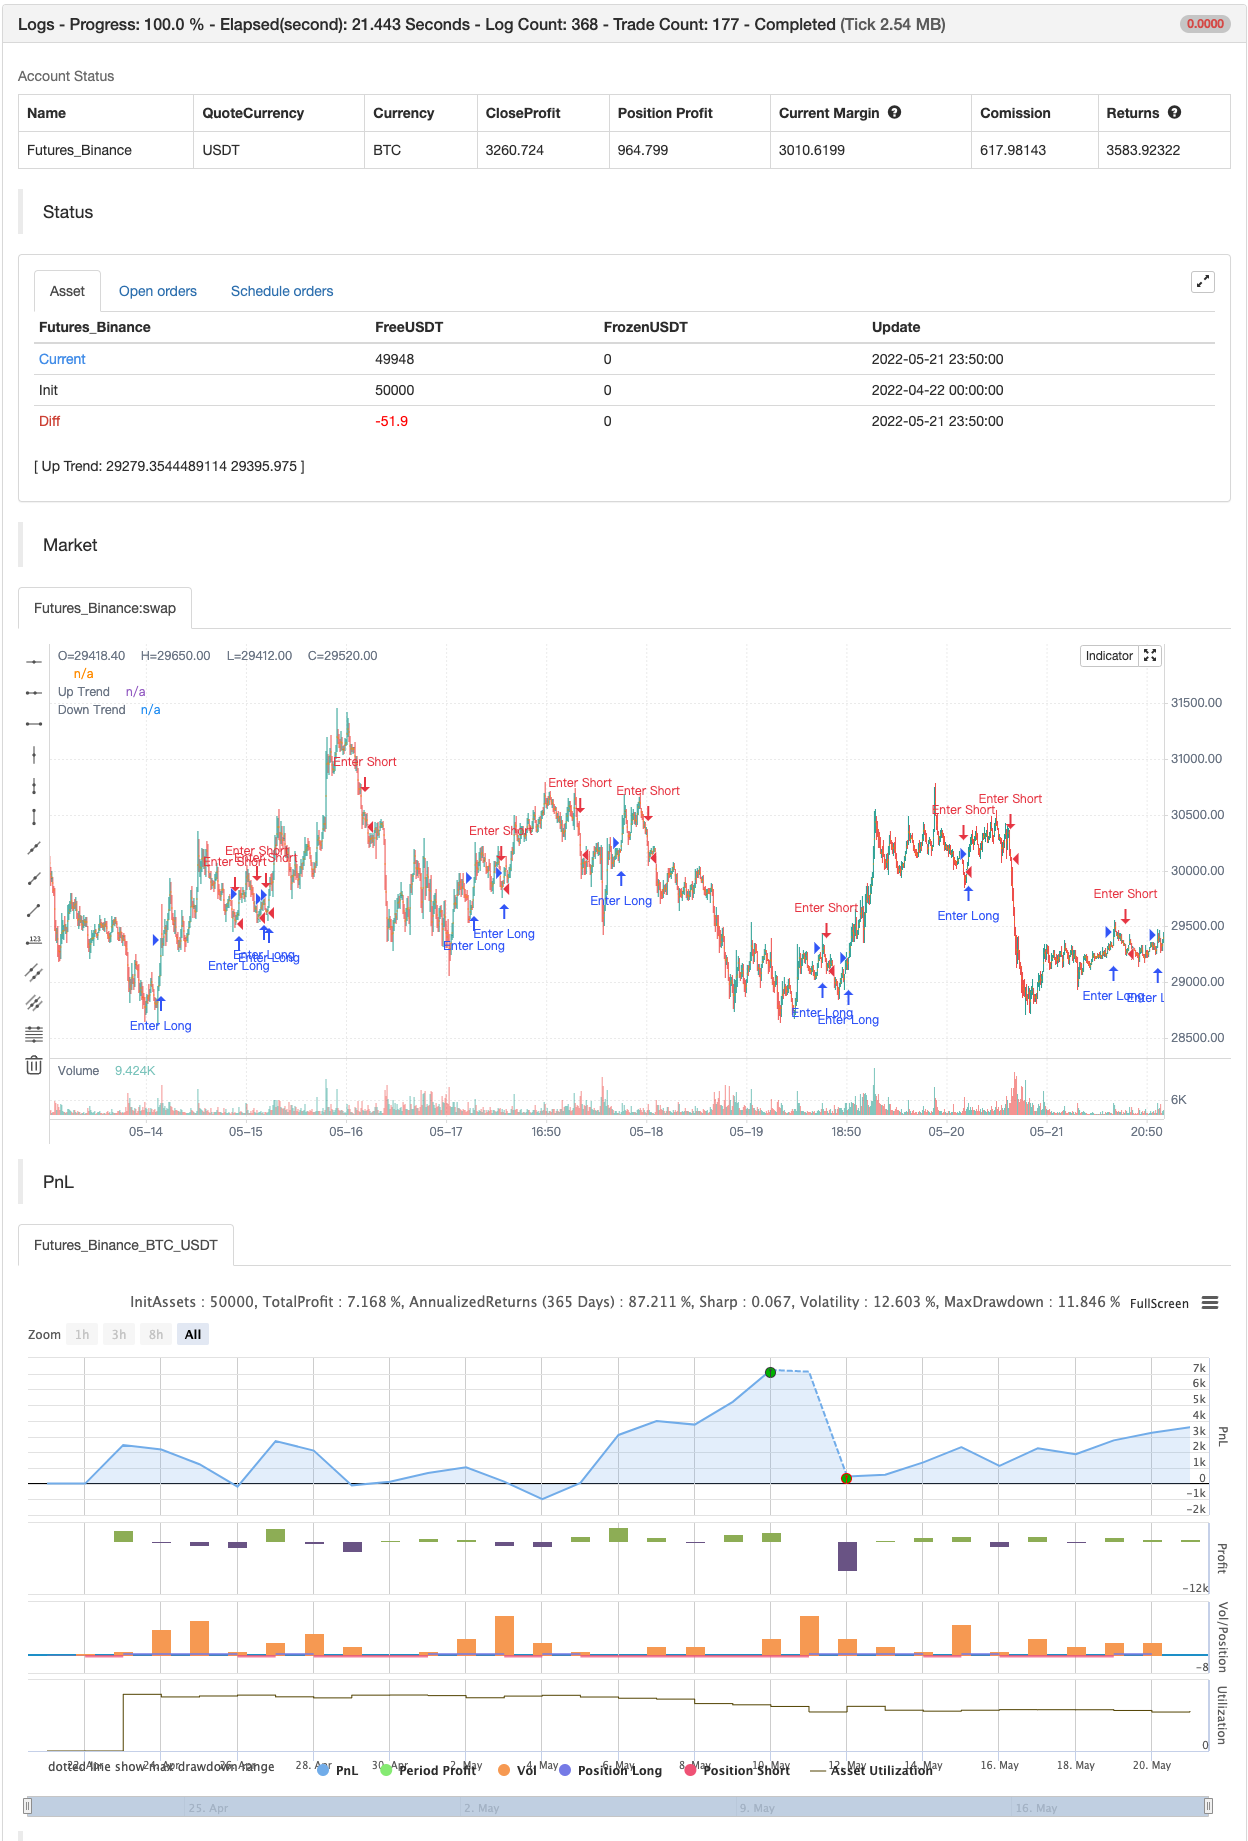
/*backtest
start: 2022-04-22 00:00:00
end: 2022-05-21 23:59:00
period: 10m
basePeriod: 1m
exchanges: [{"eid":"Futures_Binance","currency":"BTC_USDT"}]
*/

//@version=5

indicator('SuperTrended Moving Averages', 'ST MA', overlay=true, format=format.price, precision=2, timeframe='', timeframe_gaps=false)
src = input(close, title='Source')
mav = input.string(title='Moving Average Type', defval='EMA', options=['SMA', 'EMA', 'WMA', 'DEMA', 'TMA', 'VAR', 'WWMA', 'ZLEMA', 'TSF', 'HULL', 'TILL'])
length = input.int(100, 'Moving Average Length', minval=1)
Periods = input(title='ATR Period', defval=10)
Multiplier = input.float(title='ATR Multiplier', step=0.1, defval=0.5)
changeATR = input(title='Change ATR Calculation Method ?', defval=true)
showsignals = input(title='Show Buy/Sell Signals ?', defval=false)
highlighting = input(title='Highlighter On/Off ?', defval=true)


T3a1 = input.float(0.7, 'TILLSON T3 Volume Factor', step=0.1)


Var_Func(src, length) =>
    valpha = 2 / (length + 1)
    vud1 = src > src[1] ? src - src[1] : 0
    vdd1 = src < src[1] ? src[1] - src : 0
    vUD = math.sum(vud1, 9)
    vDD = math.sum(vdd1, 9)
    vCMO = nz((vUD - vDD) / (vUD + vDD))
    VAR = 0.0
    VAR := nz(valpha * math.abs(vCMO) * src) + (1 - valpha * math.abs(vCMO)) * nz(VAR[1])
    VAR
VAR = Var_Func(src, length)
DEMA = 2 * ta.ema(src, length) - ta.ema(ta.ema(src, length), length)
Wwma_Func(src, length) =>
    wwalpha = 1 / length
    WWMA = 0.0
    WWMA := wwalpha * src + (1 - wwalpha) * nz(WWMA[1])
    WWMA
WWMA = Wwma_Func(src, length)
Zlema_Func(src, length) =>
    zxLag = length / 2 == math.round(length / 2) ? length / 2 : (length - 1) / 2
    zxEMAData = src + src - src[zxLag]
    ZLEMA = ta.ema(zxEMAData, length)
    ZLEMA
ZLEMA = Zlema_Func(src, length)
Tsf_Func(src, length) =>
    lrc = ta.linreg(src, length, 0)
    lrc1 = ta.linreg(src, length, 1)
    lrs = lrc - lrc1
    TSF = ta.linreg(src, length, 0) + lrs
    TSF
TSF = Tsf_Func(src, length)
HMA = ta.wma(2 * ta.wma(src, length / 2) - ta.wma(src, length), math.round(math.sqrt(length)))
T3e1 = ta.ema(src, length)
T3e2 = ta.ema(T3e1, length)
T3e3 = ta.ema(T3e2, length)
T3e4 = ta.ema(T3e3, length)
T3e5 = ta.ema(T3e4, length)
T3e6 = ta.ema(T3e5, length)
T3c1 = -T3a1 * T3a1 * T3a1
T3c2 = 3 * T3a1 * T3a1 + 3 * T3a1 * T3a1 * T3a1
T3c3 = -6 * T3a1 * T3a1 - 3 * T3a1 - 3 * T3a1 * T3a1 * T3a1
T3c4 = 1 + 3 * T3a1 + T3a1 * T3a1 * T3a1 + 3 * T3a1 * T3a1
T3 = T3c1 * T3e6 + T3c2 * T3e5 + T3c3 * T3e4 + T3c4 * T3e3


getMA(src, length) =>
    ma = 0.0
    if mav == 'SMA'
        ma := ta.sma(src, length)
        ma

    if mav == 'EMA'
        ma := ta.ema(src, length)
        ma

    if mav == 'WMA'
        ma := ta.wma(src, length)
        ma

    if mav == 'DEMA'
        ma := DEMA
        ma

    if mav == 'TMA'
        ma := ta.sma(ta.sma(src, math.ceil(length / 2)), math.floor(length / 2) + 1)
        ma

    if mav == 'VAR'
        ma := VAR
        ma

    if mav == 'WWMA'
        ma := WWMA
        ma

    if mav == 'ZLEMA'
        ma := ZLEMA
        ma

    if mav == 'TSF'
        ma := TSF
        ma

    if mav == 'HULL'
        ma := HMA
        ma

    if mav == 'TILL'
        ma := T3
        ma
    ma

MA = getMA(src, length)


atr2 = ta.sma(ta.tr, Periods)
atr = changeATR ? ta.atr(Periods) : atr2
up = MA - Multiplier * atr
up1 = nz(up[1], up)
up := close[1] > up1 ? math.max(up, up1) : up
dn = MA + Multiplier * atr
dn1 = nz(dn[1], dn)
dn := close[1] < dn1 ? math.min(dn, dn1) : dn
trend = 1
trend := nz(trend[1], trend)
trend := trend == -1 and close > dn1 ? 1 : trend == 1 and close < up1 ? -1 : trend
upPlot = plot(trend == 1 ? up : na, title='Up Trend', color=color.new(color.green, 100), linewidth=0, style=plot.style_linebr)
buySignal = trend == 1 and trend[1] == -1
plotshape(buySignal ? up : na, title='UpTrend Begins', location=location.absolute, style=shape.circle, size=size.tiny, color=color.new(color.green, 100))
plotshape(buySignal and showsignals ? up : na, title='Buy', text='Buy', location=location.absolute, style=shape.labelup, size=size.tiny, color=color.new(color.green, 0), textcolor=color.new(color.white, 0))
dnPlot = plot(trend == 1 ? na : dn, title='Down Trend', style=plot.style_linebr, linewidth=0, color=color.new(color.red, 100))
sellSignal = trend == -1 and trend[1] == 1
plotshape(sellSignal ? dn : na, title='DownTrend Begins', location=location.absolute, style=shape.circle, size=size.tiny, color=color.new(color.red, 100))
plotshape(sellSignal and showsignals ? dn : na, title='Sell', text='Sell', location=location.absolute, style=shape.labeldown, size=size.tiny, color=color.new(color.red, 0), textcolor=color.new(color.white, 0))
mPlot = plot(ohlc4, title='', style=plot.style_circles, linewidth=0)
colorup = input.color(defval = color.new(color.green, 60), title = "ColorU", inline = 'color')
colordown = input.color(defval = color.new(color.red, 60), title = "ColorD", inline = 'color')
longFillColor = highlighting ? trend == 1 ? colorup : color.white : color.new(color.white, 100)
shortFillColor = highlighting ? trend == -1 ? colordown : color.white : color.new(color.white, 100)
fill(mPlot, upPlot, title='UpTrend Highligter', color=longFillColor)
fill(mPlot, dnPlot, title='DownTrend Highligter', color=shortFillColor)
alertcondition(buySignal, title='SuperTrend Buy', message='SuperTrend Buy!')
alertcondition(sellSignal, title='SuperTrend Sell', message='SuperTrend Sell!')
changeCond = trend != trend[1]
alertcondition(changeCond, title='SuperTrend Direction Change', message='SuperTrend has changed direction!')


if buySignal
    strategy.entry("Enter Long", strategy.long)
else if sellSignal
    strategy.entry("Enter Short", strategy.short)
- Maximisateur de bénéfices PMax
- Superjump retourner en arrière Bollinger Band
- Super scalper
- Les États membres
- Super scalper - 5 minutes 15 minutes
- Stratégie R5.1 du CCO
- 2 Détection de la direction des couleurs moyennes mobiles
- Modèle d'alerte ML
- HALFTREND + HEMA + SMA (stratégie du faux signal)
- Alerte croisée moyenne mobile (MTF) sur plusieurs délais
- Alertes de tradingView à MT4 MT5 + variables dynamiques NON-REPAINTING
- Série de matrice
- Super scalper - 5 minutes 15 minutes
- Indice de force relative - Différences - Libertus
- Régression linéaire ++
- RedK double VADER avec barres d'énergie
- Zones de consolidation - en direct
- Évaluation quantitative et qualitative
- Alerte croisée moyenne mobile (MTF) sur plusieurs délais
- La stratégie de recharge du MACD
- Échange ABC
- 15 minutes BTCUSDTPERP BOT
- L'entropie de Shannon V2
- Supertrend à l'arrière avec arrêt de traînée
- Flux de volume v3
- scalping horaire avec ma & rsi - ogcheckers
- ATR lissé
- Trouveur de blocs de commande
- Les résultats de l'analyse sont publiés dans le rapport annuel annuel annuel.
- Signaux QQE