RedK double VADER avec barres d'énergie
Auteur:ChaoZhang est là., Date: le 24 mai 2022 à 11h49Les étiquettes:SMALe taux d'intérêtLa WMA
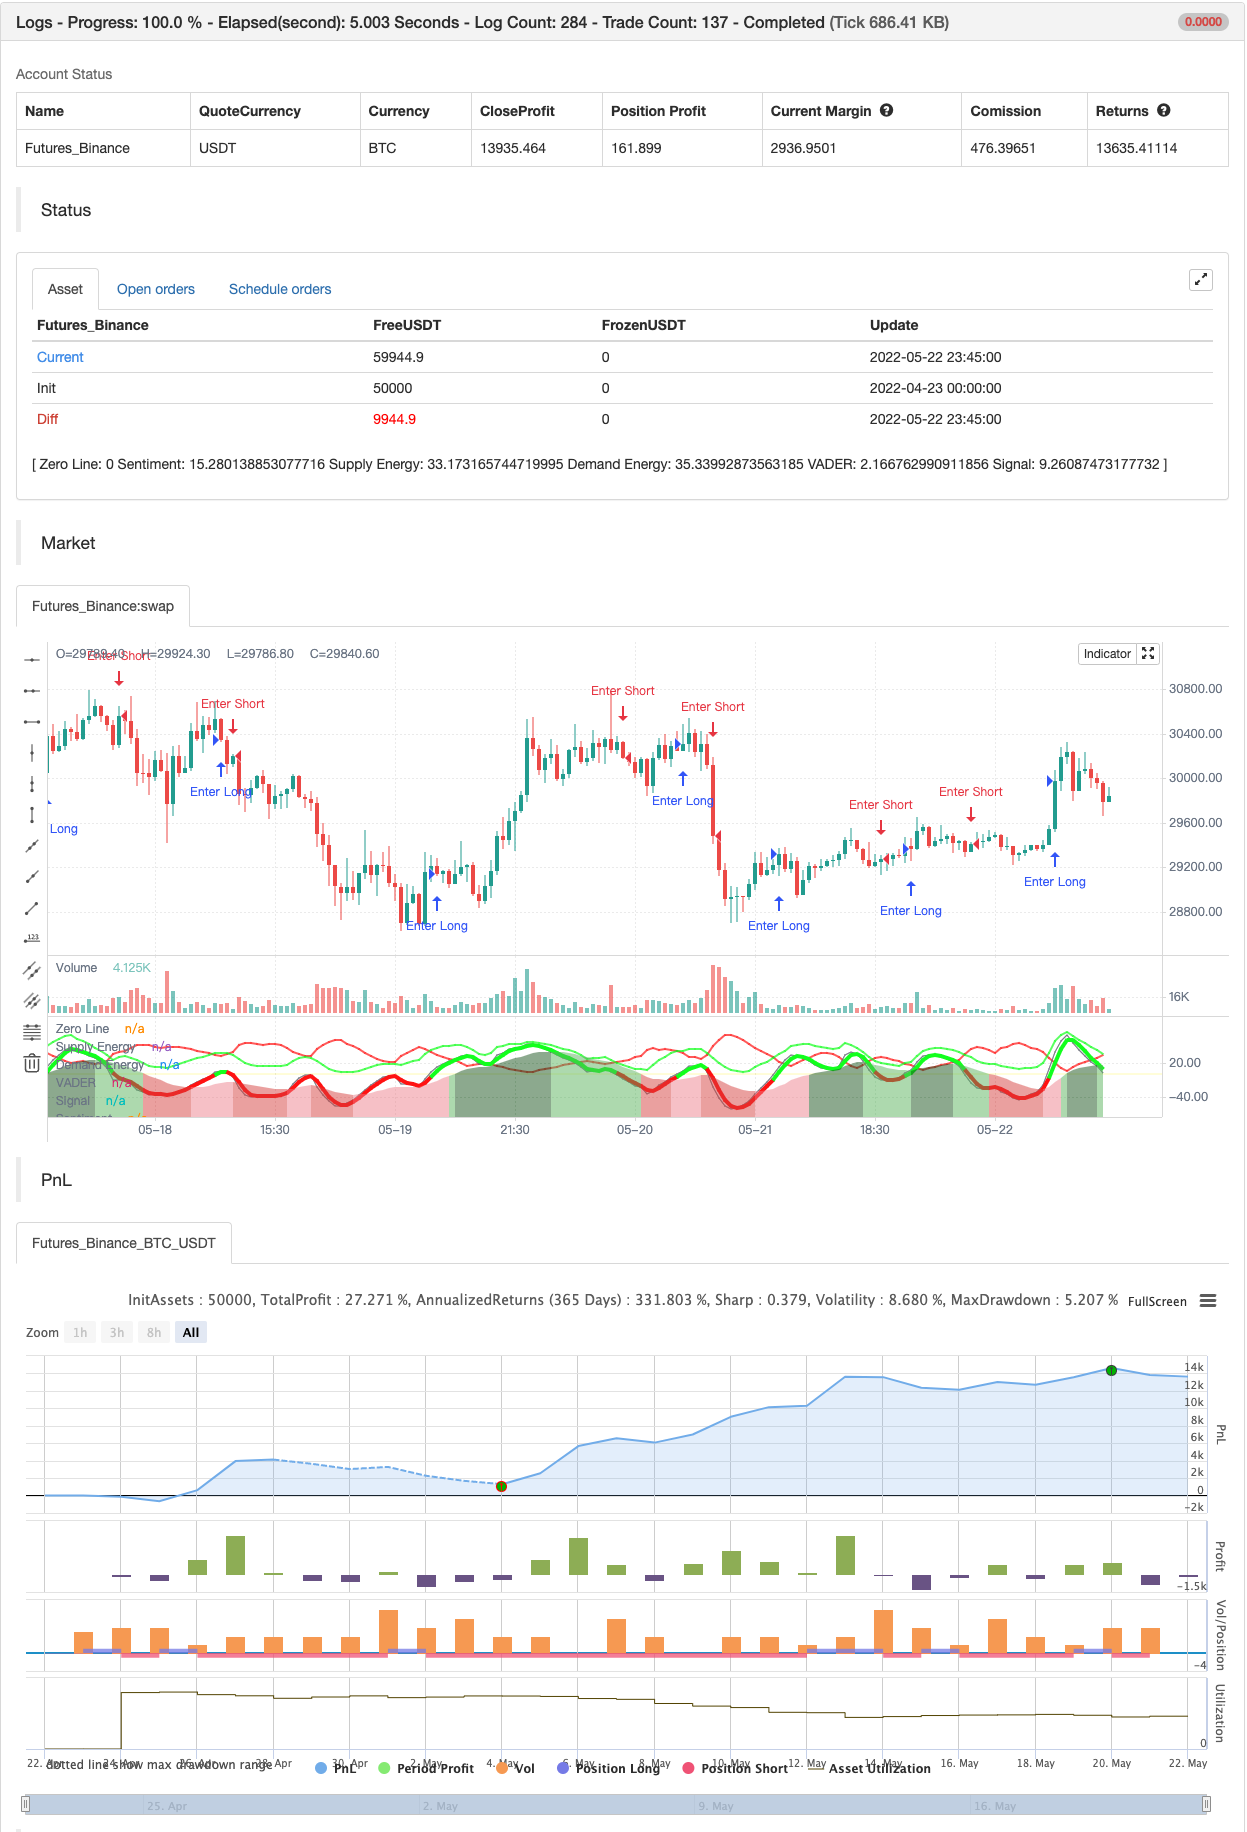
Les améliorations visuelles que j'ai ajoutées à VADER-DEB aident à mieux comprendre l'action du marché
- exposant le graphique double / long VADER par défaut (que nous utilisons comme un proxy pour le sentiment) - et il montre maintenant comme une zone (au lieu d'un histogramme) - Vous pouvez toujours cacher le graphique de sentiment dans les paramètres de l'indicateur et
- en utilisant des barres directionnelles
énergie (au lieu des lignes d'énergie dans la version 3.0).
C'est donc VADER double avec des barres d'énergie
Ces changements peuvent être considérés par certains comme mineurs, mais à mon avis, je les ai trouvés plus visuellement attrayants et meilleurs pour
Il n'y a pas de changement dans le calcul de base dans le code, comme le montre le graphique ci-dessus où nous comparons les deux versions de VADER côte à côte.
Si vous êtes satisfait de VADER v3.0, n'hésitez pas à continuer à l'utiliser.
Bonne chance, tout le monde!
test de retour
/*backtest
start: 2022-04-23 00:00:00
end: 2022-05-22 23:59:00
period: 45m
basePeriod: 5m
exchanges: [{"eid":"Futures_Binance","currency":"BTC_USDT"}]
*/

// This source code is subject to the terms of the Mozilla Public License 2.0 at https://mozilla.org/MPL/2.0/
// © RedKTrader

//@version=5
indicator('RedK Dual VADER with Energy Bars [VADER-DEB]', 'RedK VADER-DEB v4.0', precision=0, timeframe='', timeframe_gaps=false)

// This version is the same as VADER v3.0 with enhanced visuals, using Energy Bars instead of the positive/energy lines
// Sentiment plot changed from histogram to area and is exposed by default (hence Dual w/ Energy Bars -- DEB)
// No change in core calculations from VADER v3.0  -- and that's why i'll just call it VADER v4.0

// ***********************************************************************************************************
// Choose volume calculation method.. Relative vs full.
// Relative magnifies effect of recent volume spikes (up or down)
f_RelVol(_value, _length) =>
    min_value = ta.lowest(_value, _length)
    max_value = ta.highest(_value, _length)
    ta.stoch(_value, max_value, min_value, _length) / 100
// ***********************************************************************************************************

// ***********************************************************************************************************
// Choose MA type for the base DER calculation ..
// WMA is my preference and is default .. SMA is really slow and lags a lot - but added for comparison
f_derma(_data, _len, MAOption) =>
    value =
      MAOption == 'SMA' ? ta.sma(_data, _len) :
      MAOption == 'EMA' ? ta.ema(_data, _len) :
      ta.wma(_data, _len)
// ***********************************************************************************************************


// ===========================================================================================================
//      Inputs
// ===========================================================================================================

price   = close
length  = input.int(10, minval=1)
DER_avg = input.int(5, 'Average', minval=1, inline='DER', group='Directional Energy Ratio')
MA_Type = input.string('WMA', 'DER MA type', options=['WMA', 'EMA', 'SMA'], inline='DER', group='Directional Energy Ratio')
smooth  = input.int(3, 'Smooth', minval=1,  inline='DER_1', group='Directional Energy Ratio')

show_senti = input.bool(true, 'Sentiment',  inline='DER_s', group='Directional Energy Ratio')
senti   = input.int(20, 'Length', minval=1, inline='DER_s', group='Directional Energy Ratio')


v_calc  = input.string('Relative', 'Calculation', options=['Relative', 'Full', 'None'], group='Volume Parameters')
vlookbk = input.int(20, 'Lookback (for Relative)', minval=1,                            group='Volume Parameters')

// ===========================================================================================================
//          Calculations
// ===========================================================================================================

// Volume Calculation Option  -- will revert to no volume acceleration for instruments with no volume data
vola    =
  v_calc == 'None' or na(volume) ? 1 :
  v_calc == 'Relative' ? f_RelVol(volume, vlookbk) :
  volume

R       = (ta.highest(2) - ta.lowest(2)) / 2                    // R is the 2-bar average bar range - this method accomodates bar gaps
sr      = ta.change(price) / R                                  // calc ratio of change to R
rsr     = math.max(math.min(sr, 1), -1)                         // ensure ratio is restricted to +1/-1 in case of big moves
c       = fixnan(rsr * vola)                                    // add volume accel -- fixnan adresses cases where no price change between bars

c_plus  = math.max(c, 0)                                        // calc directional vol-accel energy
c_minus = -math.min(c, 0)

// plot(c_plus)
// plot(c_minus)


avg_vola    = f_derma(vola, length, MA_Type)
dem         = f_derma(c_plus, length, MA_Type)  / avg_vola          // directional energy ratio
sup         = f_derma(c_minus, length, MA_Type) / avg_vola

adp         = 100 * ta.wma(dem, DER_avg)                            // average DER
asp         = 100 * ta.wma(sup, DER_avg)
anp         = adp - asp                                             // net DER..
anp_s       = ta.wma(anp, smooth)

// Calculate Sentiment - a VADER for a longer period and can act as a baseline (compared to a static 0 value)
// note we're not re-calculating vol_avg, demand or supply energy for sentiment. this would've been a different approach
s_adp       = 100 * ta.wma(dem, senti)                            // average DER for sentiment length
s_asp       = 100 * ta.wma(sup, senti)
V_senti     = ta.wma(s_adp - s_asp, smooth)


// ===========================================================================================================
//      Colors & plots
// ===========================================================================================================
c_adp   = color.new(#11ff20, 30)
c_asp   = color.new(#ff1111, 30)
c_fd    = color.new(color.green, 80)
c_fs    = color.new(color.red, 80)
c_zero  = color.new(#ffee00, 70)

c_up    = color.new(#11ff20, 0)
c_dn    = color.new(#ff1111, 0)

up      = anp_s >= 0
s_up    = V_senti >=0

hline(0, 'Zero Line', c_zero, hline.style_solid)

// =============================================================================
// v4.0 --- Sentiment will be represented as a 4-color area graph
c_grow_above = #1b5e2080
c_grow_below = #dc4c4a80
c_fall_above = #66bb6a80
c_fall_below = #ef8e9880

sflag_up = math.abs(V_senti) >= math.abs(V_senti[1])

plot(show_senti ? V_senti : na, "Sentiment", style=plot.style_area,
 color = s_up ? (sflag_up ? c_grow_above : c_fall_above) :
 sflag_up ? c_grow_below : c_fall_below)

// ===========================================================================================================
//      v4.0 Use Energy Bars instead of DER lines
// ===========================================================================================================

// Prep the Energy Bars
bo = asp
bc = adp
bh = math.max(bo, bc)
bl = math.min(bo, bc)

rising      = ta.change(bc) > 0

c_barup     = #11ff2088
c_bardn     = #ff111188
c_bardj     = #ffffff88

barcolor    = bc > bo and rising ? c_barup : bc < bo and not rising ? c_bardn : c_bardj
//plotcandle(bo, bh, bl, bc, 'Energy Bars', barcolor, barcolor, bordercolor = barcolor)

// ============================================================================================================

s = plot(asp, 'Supply Energy', c_asp, 2, display = display.none)
d = plot(adp, 'Demand Energy', c_adp, 2, display = display.none)

plot(anp, 'VADER', color.new(color.gray, 30), display=display.none)
plot(anp_s, 'Signal', up ? c_up : c_dn, 4)

// ===========================================================================================================
//      v2.0 adding alerts
// ===========================================================================================================

Alert_up    = ta.crossover(anp_s,0)
Alert_dn    = ta.crossunder(anp_s,0)
Alert_swing = ta.cross(anp_s,0)

// "." in alert title for the alerts to show in the right order up/down/swing
alertcondition(Alert_up,    ".   VADER Crossing 0 Up",      "VADER Up - Buying Energy Detected!")
alertcondition(Alert_dn,    "..  VADER Crossing 0 Down",    "VADER Down - Selling Energy Detected!")
alertcondition(Alert_swing, "... VADER Crossing 0",         "VADER Swing - Possible Reversal")

// ===========================================================================================================
//      v3.0 more alerts for VADER crossing Sentiment
// ===========================================================================================================

v_speedup = ta.crossover(anp_s, V_senti)
v_slowdn  = ta.crossunder(anp_s, V_senti)
alertcondition(v_speedup,   "*  VADER Speeding Up",      "VADER Speeding Up!")
alertcondition(v_slowdn,    "** VADER Slowing Down",    "VADER Slowing Down!")


if Alert_up
    strategy.entry("Enter Long", strategy.long)
else if Alert_dn
    strategy.entry("Enter Short", strategy.short)
- Stratégie de négociation quantitative basée sur les moyennes mobiles et les bandes de Bollinger
- Alerte croisée moyenne mobile (MTF) sur plusieurs délais
- HALFTREND + HEMA + SMA (stratégie du faux signal)
- Ratio énergie directionnelle accélérée par volume RedK
- Oscillateur arc-en-ciel
- Les barres de dynamique REDK
- Les États membres
- Super scalper
- Superjump retourner en arrière Bollinger Band
- Le MACD est plus intelligent
- Meilleure stratégie d' engloutissement + de rupture
- Bollinger Awesome Alerte R1 Pour les produits de base
- Plugin de partage multi-échanges
- Le triangle de l'intérêt (l'écart entre les prix de vente des petites devises)
- Grille dynamique par contrat inverse bybit (grille spécifique)
- Alertes de tradingView à MT4 MT5 + variables dynamiques NON-REPAINTING
- Série de matrice
- Super scalper - 5 minutes 15 minutes
- Indice de force relative - Différences - Libertus
- Régression linéaire ++
- Zones de consolidation - en direct
- Évaluation quantitative et qualitative
- Alerte croisée moyenne mobile (MTF) sur plusieurs délais
- La stratégie de recharge du MACD
- Les moyennes mobiles à tendance supérieure
- Échange ABC
- 15 minutes BTCUSDTPERP BOT
- L'entropie de Shannon V2
- Supertrend à l'arrière avec arrêt de traînée
- Flux de volume v3