Indice de change stochastique extrême
Auteur:ChaoZhang est là., Date: 2021-05-31 19h16 et 17hLes étiquettes:Indice de résistanceBoll
C'est le code final publié au public que j'ai créé dans une vidéo liée ici.
Cet indicateur combine une bande de Bollinger et un RSI stochastique pour produire des signaux pour un éventuel renversement des prix. Les signaux sont affichés par défaut sous forme de flèches vertes pour la hausse et de flèches rouges pour la baisse.
Pour déclencher un signal, l'indicateur vérifie ce qui suit:
Je suis en hausse. Une bougie se ferme au-dessus de la bande supérieure de Bollinger La bougie suivante se ferme dans la bande supérieure de Bollinger L'indicateur RSI Stochastique est inférieur au seuil fixé (10 par défaut)
Je ne sais pas. Une bougie se ferme en dessous de la bande inférieure de Bollinger. La bougie suivante se ferme dans la bande de Bollinger inférieure L'indicateur RSI Stochastique est supérieur au seuil défini (90 par défaut)
test de retour
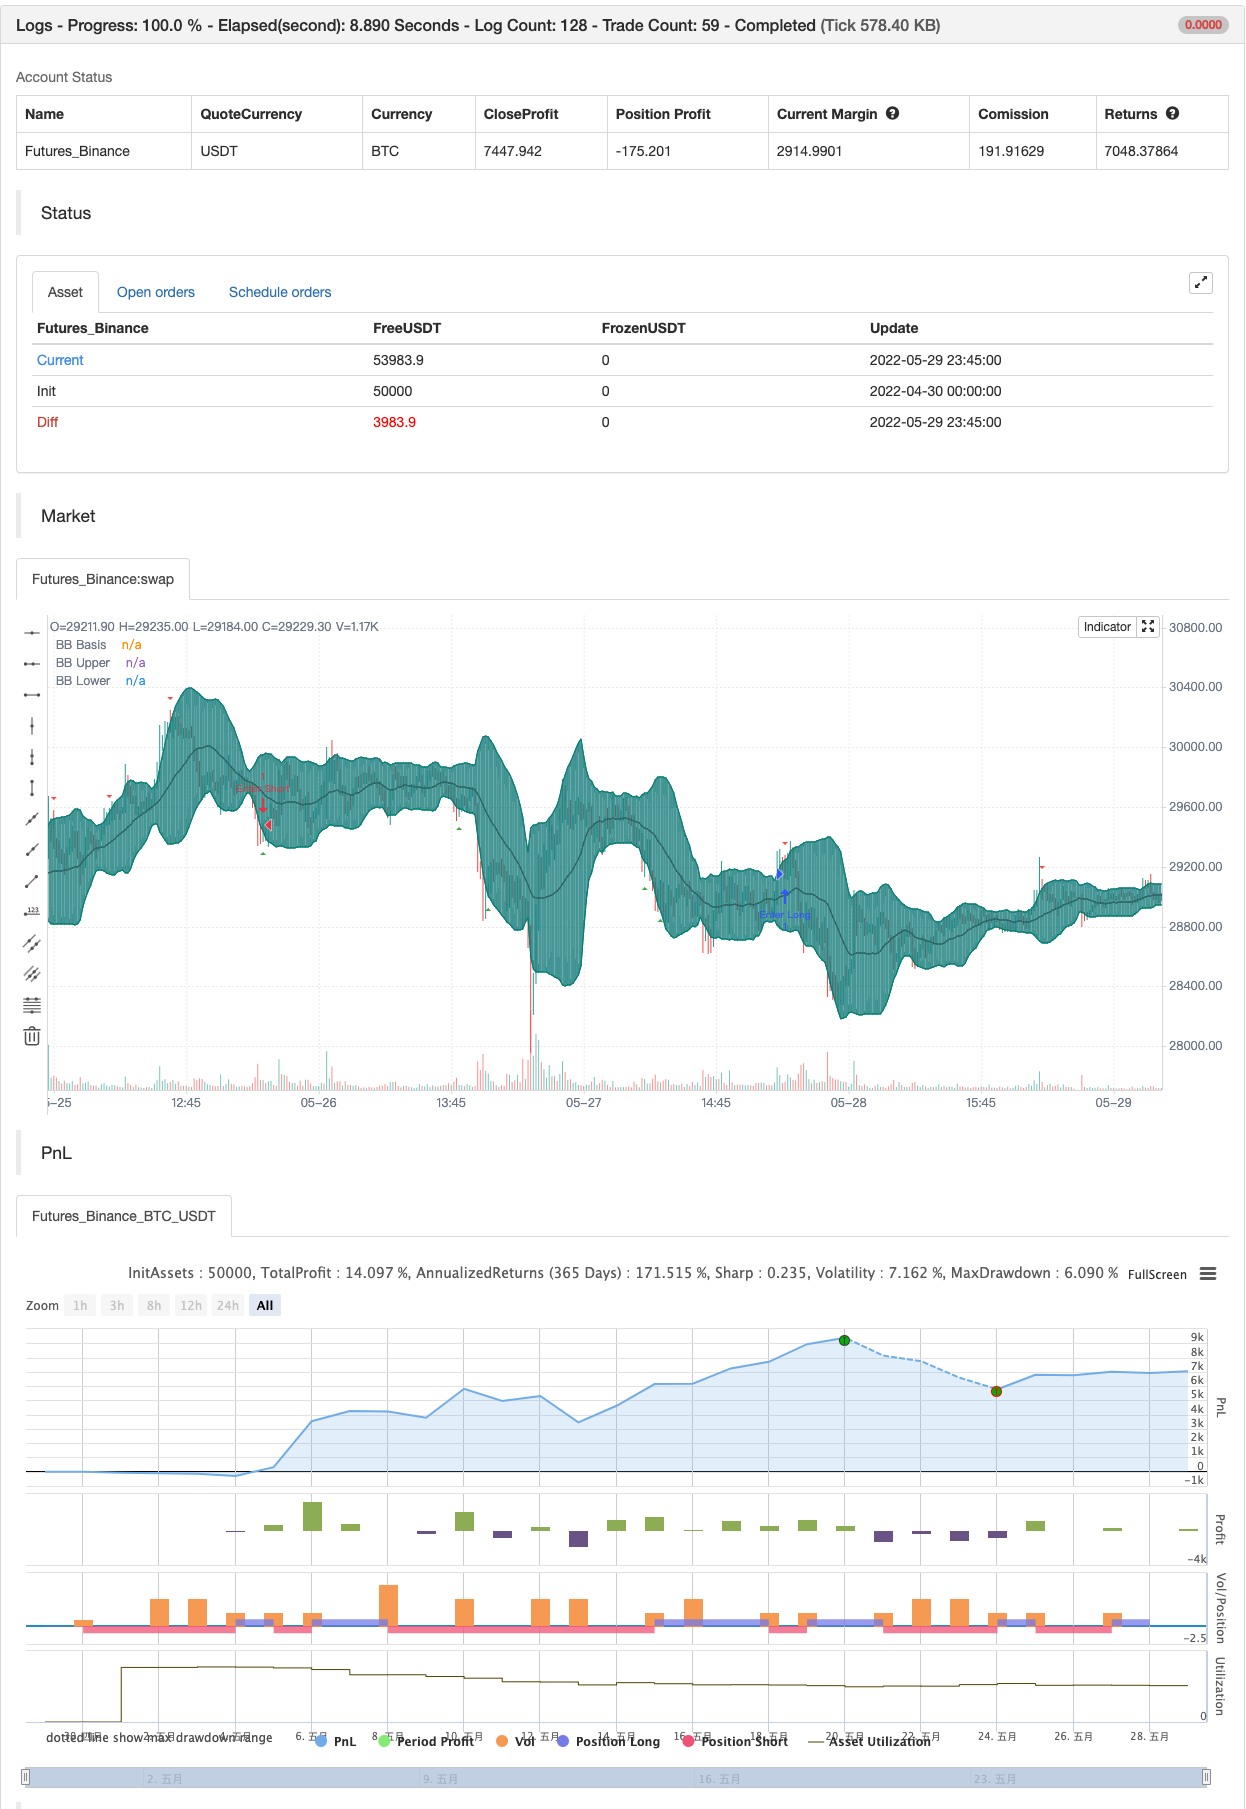
/*backtest
start: 2022-04-30 00:00:00
end: 2022-05-29 23:59:00
period: 15m
basePeriod: 5m
exchanges: [{"eid":"Futures_Binance","currency":"BTC_USDT"}]
*/

//@version=4
study(shorttitle="BBSR Extreme", title="Bollinger Bands Stochastic RSI Extreme Signal", overlay=true, resolution="")

//General Inputs
src = input(close, title="Source")
offset = input(0, "Offset", type = input.integer, minval = -500, maxval = 500)

//Bollinger Inputs
length = input(20, title="Bollinger Band Length", minval=1)
mult = input(2.0, minval=0.001, maxval=50, title="StdDev")

//Bollinger Code
basis = sma(src, length)
dev = mult * stdev(src, length)
upper = basis + dev
lower = basis - dev
plot(basis, "BB Basis", color=#872323, offset = offset)
p1 = plot(upper, "BB Upper", color=color.teal, offset = offset)
p2 = plot(lower, "BB Lower", color=color.teal, offset = offset)
fill(p1, p2, title = "BB Background", color=#198787, transp=95)


//Stoch Inputs
smoothK = input(3, "K", minval=1)
smoothD = input(3, "D", minval=1)
lengthRSI = input(14, "RSI Length", minval=1)
lengthStoch = input(14, "Stochastic Length", minval=1)

upperlimit = input(90, "Upper Limit", minval=0.01)
lowerlimit = input(10, "Upper Limit", minval=0.01)

//Stochastic Code
rsi1 = rsi(src, lengthRSI)
k = sma(stoch(rsi1, rsi1, rsi1, lengthStoch), smoothK)
d = sma(k, smoothD)

//Evaluation
Bear = close[1] > upper[1] and close < upper
     and k[1] > upperlimit and d[1] > upperlimit
Bull = close[1] < lower[1] and close > lower
     and k[1] < lowerlimit and d[1] < lowerlimit


//Plots
plotshape(Bear, style=shape.triangledown, location=location.abovebar,
     color=color.red, size=size.tiny)
plotshape(Bull, style=shape.triangleup, location=location.belowbar,
     color=color.green, size=size.tiny)

// Alert Functionality
alertcondition(Bear or Bull, title="Any Signal", message="{{exchange}}:{{ticker}}" + " {{interval}}" + " BB Stochastic Extreme!")
alertcondition(Bear, title="Bearish Signal", message="{{exchange}}:{{ticker}}" + " {{interval}}" + " Bearish BB Stochastic Extreme!")
alertcondition(Bull, title="Bullish Signal", message="{{exchange}}:{{ticker}}" + " {{interval}}" + " Bullish BB Stochastic Extreme!")


if Bear
    strategy.entry("Enter Long", strategy.long)
else if Bull
    strategy.entry("Enter Short", strategy.short)
- Théorie des ondes d'Elliott 4-9 Détection automatique des ondes d'impulsion Stratégie de trading
- SuperTREX
- Stratégie d'optimisation statistique du RSI
- Stratégie de négociation automatisée basée sur les niveaux de surachat et de survente du RSI
- RSI MTF Ob+Os
- Bollinger + RSI, stratégie double v1.1
- Stratégie de l'indice de résistance relative de l'indice RSI
- RSI - Signaux d'achat et de vente
- Le TMA-Legacy
- Stratégie de négociation à inversion à haute fréquence basée sur l'indicateur de dynamique RSI
- Filtre de gamme Acheter et vendre 5 minutes [stratégie]
- Marteau inversé - Options étendues
- Les données de référence doivent être fournies à l'autorité compétente de l'État membre où le véhicule est situé.
- Filtre à double portée
- SAR - haut et bas
- Système de négociation de swing précis
- Tendance linéaire
- Modèle de synchronisation de Fibonacci
- Boîte Darvas acheter vendre
- Indicateur de configuration de démarrage
- Indicateur MACD BB V 1,00
- SAR parabolique
- Indicateur de divergence RSI
- Indicateur OBV MACD
- Tendance de pivot
- Stratégie de divergence des prix v1.0
- Dépassement du support-résistance
- Moyenne mobile adaptative de pente
- Stratégie de l'oscillateur Delta-RSI
- Stratégie de cryptographie à faible balayage