Stratégie de trading à moyenne mobile exponentielle triple et à moyenne mobile exponentielle stochastique
Aperçu
Cette stratégie est une stratégie de suivi de tendance qui combine un indicateur de moyenne mobile à triple indice et un indicateur de moyenne mobile à glissement lisse à indice aléatoire pour générer un signal de transaction. Lorsque la moyenne mobile rapide est traversée par la moyenne mobile rapide, la moyenne moyenne est traversée par la moyenne mobile lente. Lorsque la moyenne mobile rapide est traversée par la moyenne mobile rapide, la moyenne moyenne est traversée par la moyenne mobile lente.
Le principe
Utilisez des moyennes mobiles triplées à 8, 14 et 50 jours. Lorsque vous traversez une moyenne mobile à 14 jours sur une moyenne mobile à 8 jours, vous obtenez un signal de plus-value lorsque vous traversez une moyenne mobile à 50 jours sur une moyenne mobile à 14 jours; au contraire, un signal de négligence.
L’indicateur de moyenne mobile lisse à indice aléatoire ((Stochastic RSI) est utilisé comme indicateur de jugement auxiliaire. Plus précisément: d’abord, le RSI de 14 jours est calculé, puis l’indicateur stochastique est calculé sur la base de l’indicateur RSI, et enfin la ligne K est obtenue pour le calcul de la moyenne mobile simple de 3 jours et la ligne D est obtenue pour le calcul de la moyenne mobile simple de 3 jours.
Lors de la génération d’un signal de transaction, si le prix est supérieur à la moyenne mobile de l’indice du 8e jour, l’entrée est en hausse; si le prix est inférieur à la moyenne mobile de l’indice du 8e jour, l’entrée est en baisse.
Le stop loss est situé au-dessus/au-dessous du prix d’entrée à 1 fois l’ATR. Le stop stop est situé au-dessus/au-dessous du prix d’entrée à 4 fois l’ATR.
Les avantages
Les moyennes mobiles, en tant qu’indicateurs de base, permettent de suivre efficacement les tendances du marché. Les moyennes mobiles triangulaires sont utilisées en combinaison avec plusieurs cycles, ce qui permet de garantir une sensibilité aux tendances à court et à moyen terme.
L’ajout du RSI stochastique en tant qu’indicateur de jugement auxiliaire permet de filtrer les faux signaux et d’améliorer la précision de l’entrée.
En réglant le stop loss en fonction de l’ATR, vous pouvez suivre dynamiquement la volatilité du marché et éviter que le stop loss soit trop grand ou trop petit.
La stratégie a une configuration de paramètres raisonnable et fonctionne bien dans les grandes tendances. Les retraits sont faibles, les gains sont stables et conviennent aux opérations sur les lignes longues.
Les risques
Une stratégie de combinaison multi-indicateurs augmente le risque de revers. Des erreurs de signal de négociation peuvent survenir lorsque les moyennes mobiles et le RSI stochastique émettent des signaux opposés. Il est alors nécessaire de prêter attention à la tendance du prix lui-même.
Les paramètres d’arrêt et d’arrêt sont plus conservateurs et peuvent être brisés lors de fortes fluctuations du marché, ce qui peut entraîner une rupture et une perte de tendance. Il est alors possible d’ajuster le paramètre ATR ou d’augmenter le multiplicateur de l’arrêt de perte.
En raison de l’utilisation d’une moyenne mobile triple, il y a un certain retard lorsque les lignes rapides et moyennes sont inversées. Il est alors nécessaire de se concentrer sur le fait que le prix lui-même est inversé pour décider de l’entrée.
Cette stratégie est principalement adaptée aux tendances tendancielles, qui ne fonctionnent pas bien dans les conditions de consolidation. Il est possible d’envisager d’optimiser les paramètres périodiques des moyennes mobiles ou d’utiliser d’autres indicateurs de jugement.
Optimisation
D’autres indicateurs, tels que le MACD, peuvent être envisagés pour optimiser davantage le timing de l’entrée. Des combinaisons de moyennes mobiles de différents paramètres peuvent également être testées.
Il est possible d’optimiser les paramètres de l’ATR de vérification de la polyvalence. Par exemple, ajuster le stop loss de 1 ATR à 1.5 ATR et le stop loss de 4 ATR à 3 ATR pour voir si un meilleur rendement est possible.
Il est possible de tester avec des moyennes mobiles uniquement, en supprimant l’indicateur RSI stochastique, pour voir si l’on peut filtrer plus de bruit et obtenir des gains plus stables.
Il est possible d’envisager d’ajouter d’autres conditions pour juger de la tendance, par exemple en ajoutant des indicateurs de volume de transactions pour s’assurer que la tendance fonctionne à grande échelle.
Résumer
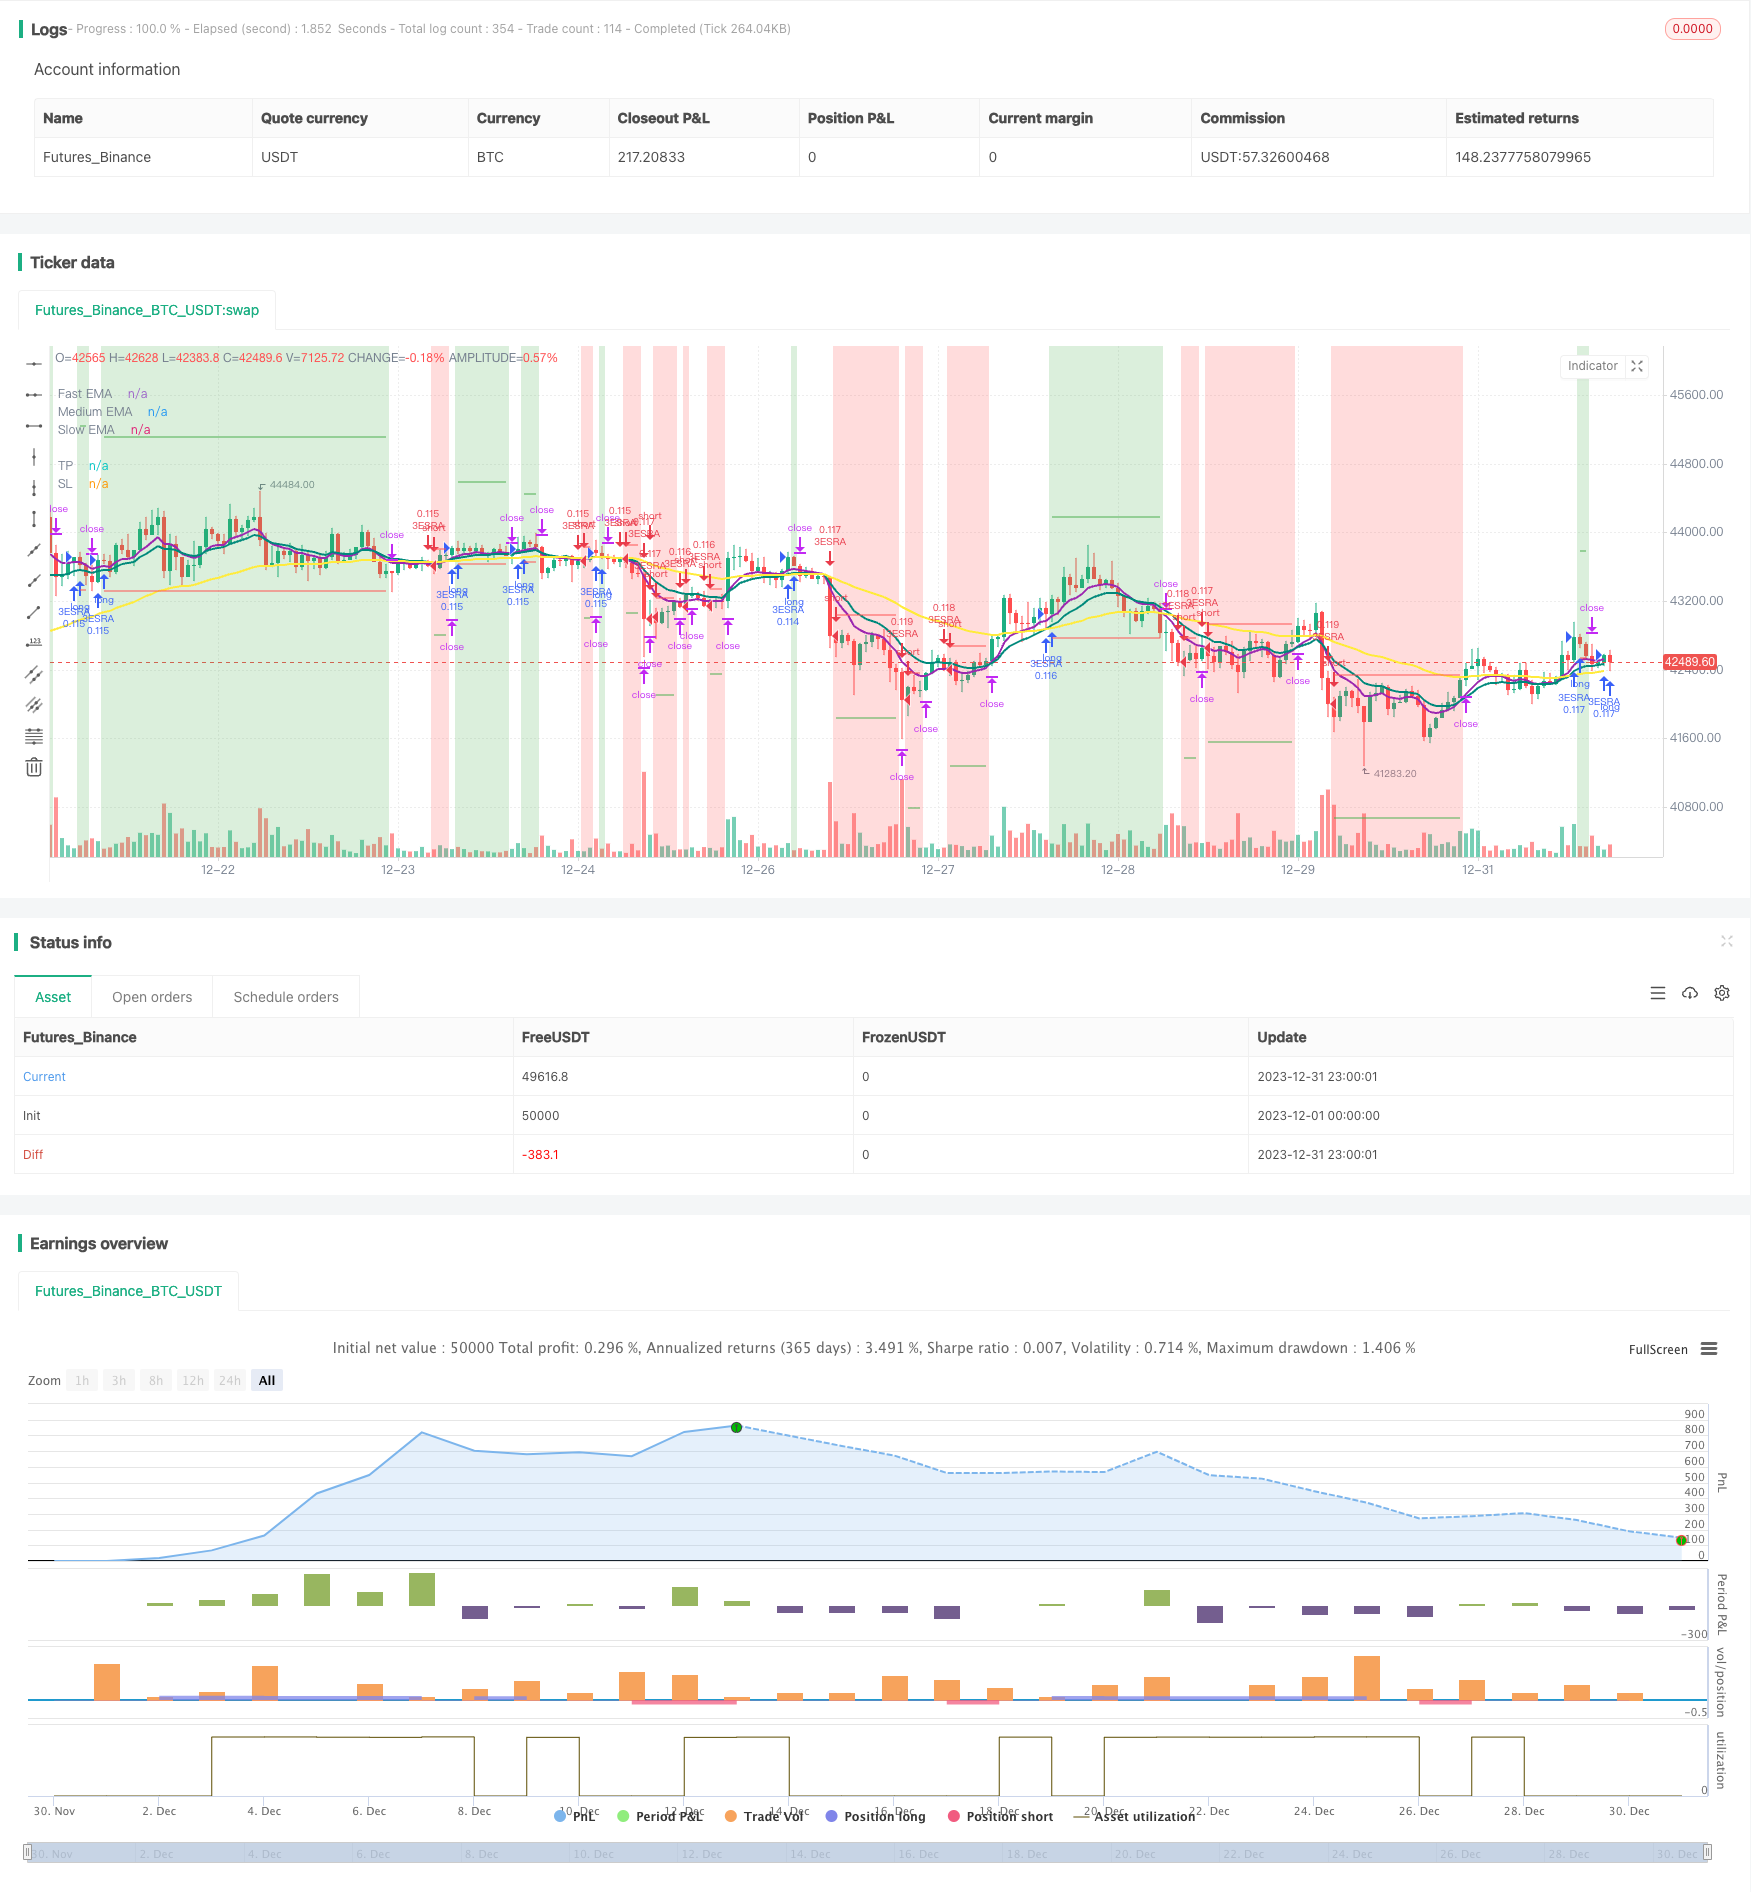
La stratégie utilise des moyennes mobiles à triple indice et des indices RSI stochastiques pour déterminer la direction de la tendance. Les signaux d’entrée sont plus stricts et permettent de réduire efficacement les transactions sans importance. Le paramètre de la stratégie est auto-adaptatif grâce à un paramètre de suivi dynamique de l’ATR.
/*backtest
start: 2023-12-01 00:00:00
end: 2023-12-31 23:59:59
period: 1h
basePeriod: 15m
exchanges: [{"eid":"Futures_Binance","currency":"BTC_USDT"}]
*/

//              3ESRA
//              v0.2a

// Coded by Vaida Bogdan

// 3ESRA consists of a 3 EMA cross + a close above (for longs) the quickest EMA
// or below (for shorts). Note that I've deactivated the RSI Cross Over/Under
// (you can modify the code and activate it). The strategy also uses a stop loss
// that's at 1 ATR distance from the entry price and a take profit that's at
// 4 times the ATR distance from the entry price.

// Feedback:
// Tested BTCUSDT Daily
// 1. Stoch-RSI makes you miss opportunities.
// 2. Changing RR to 4:1 times ATR works better.

//@version=4
strategy(title="3 EMA + Stochastic RSI + ATR", shorttitle="3ESRA", overlay=true, pyramiding=1,
     process_orders_on_close=true, calc_on_every_tick=true,
     initial_capital=1000, currency = currency.USD, default_qty_value=10,
     default_qty_type=strategy.percent_of_equity,
     commission_type=strategy.commission.percent, commission_value=0.1, slippage=2)

startDate = input(title="Start Date", type=input.integer,
     defval=1, minval=1, maxval=31, group="Backtesting range")
startMonth = input(title="Start Month", type=input.integer,
     defval=1, minval=1, maxval=12, group="Backtesting range")
startYear = input(title="Start Year", type=input.integer,
     defval=1900, minval=1800, maxval=2100, group="Backtesting range")
endDate = input(title="End Date", type=input.integer,
     defval=1, minval=1, maxval=31, group="Backtesting range")
endMonth = input(title="End Month", type=input.integer,
     defval=1, minval=1, maxval=12, group="Backtesting range")
endYear = input(title="End Year", type=input.integer,
     defval=2040, minval=1800, maxval=2100, group="Backtesting range")

// Date range filtering
inDateRange = (time >= timestamp(syminfo.timezone, startYear, startMonth, startDate, 0, 0)) and
     (time < timestamp(syminfo.timezone, endYear, endMonth, endDate, 23, 59))

fast = input(8, minval=8, title="Fast EMA", group="EMAs")
medium = input(14, minval=8, title="Medium EMA", group="EMAs")
slow = input(50, minval=8, title="Slow EMA", group="EMAs")
src = input(close, title="Source")

smoothK = input(3, "K", minval=1, group="Stoch-RSI", inline="K&D")
smoothD = input(3, "D", minval=1, group="Stoch-RSI", inline="K&D")
lengthRSI = input(14, "RSI Length", minval=1, group="Stoch-RSI", inline="length")
lengthStoch = input(14, "Stochastic Length", minval=1, group="Stoch-RSI", inline="length")
rsiSrc = input(close, title="RSI Source", group="Stoch-RSI")

length = input(title="Length", defval=14, minval=1, group="ATR")
smoothing = input(title="Smoothing", defval="RMA", options=["RMA", "SMA", "EMA", "WMA"], group="ATR")

// EMAs
fastema = ema(src, fast)
mediumema = ema(src, medium)
slowema = ema(src, slow)

// S-RSI
rsi1 = rsi(rsiSrc, lengthRSI)
k = sma(stoch(rsi1, rsi1, rsi1, lengthStoch), smoothK)
d = sma(k, smoothD)
sRsiCrossOver = k[1] < d[1] and k > d
sRsiCrossUnder = k[1] > d[1] and k < d

// ATR
ma_function(source, length) =>
	if smoothing == "RMA"
		rma(source, length)
	else
		if smoothing == "SMA"
			sma(source, length)
		else
			if smoothing == "EMA"
				ema(source, length)
			else
				wma(source, length)
atr = ma_function(tr(true), length)

// Trading Logic
longCond1 = (fastema > mediumema) and (mediumema > slowema)
longCond2 = true
// longCond2 = sRsiCrossOver
longCond3 = close > fastema
longCond4 = strategy.position_size <= 0
longCond = longCond1 and longCond2 and longCond3 and longCond4 and inDateRange

shortCond1 = (fastema < mediumema) and (mediumema < slowema)
shortCond2 = true
// shortCond2 = sRsiCrossUnder
shortCond3 = close < fastema
shortCond4 = strategy.position_size >= 0
shortCond = shortCond1 and shortCond2 and shortCond3 and shortCond4 and inDateRange

var takeProfit = float(na), var stopLoss = float(na)
if longCond and strategy.position_size <= 0
    takeProfit := close + 4*atr
    stopLoss := close - 1*atr
    // takeProfit := close + 2*atr
    // stopLoss := close - 3*atr

else if shortCond and strategy.position_size >= 0
    takeProfit := close - 4*atr
    stopLoss := close + 1*atr
    // takeProfit := close - 2*atr
    // stopLoss := close + 3*atr

// Strategy calls
strategy.entry("3ESRA", strategy.long, comment="Long", when=longCond and strategy.position_size <= 0)
strategy.entry("3ESRA", strategy.short, comment="Short", when=shortCond and strategy.position_size >= 0)
strategy.exit(id="TP-SL", from_entry="3ESRA", limit=takeProfit, stop=stopLoss)
if (not inDateRange)
    strategy.close_all()

// Plot EMAs
plot(fastema, color=color.purple, linewidth=2, title="Fast EMA")
plot(mediumema, color=color.teal, linewidth=2, title="Medium EMA")
plot(slowema, color=color.yellow, linewidth=2, title="Slow EMA")
// Plot S-RSI
// plotshape((strategy.position_size > 0) ? na : sRsiCrossOver, title="StochRSI Cross Over", style=shape.triangleup, location=location.belowbar, color=color.teal, text="SRSI", size=size.small)
// Plot trade
bgcolor(strategy.position_size > 0 ? color.new(color.green, 75) : strategy.position_size < 0 ? color.new(color.red,75) : color(na))
// Plot Strategy
plot((strategy.position_size != 0) ? takeProfit : na, style=plot.style_linebr, color=color.green, title="TP")
plot((strategy.position_size != 0) ? stopLoss : na, style=plot.style_linebr, color=color.red, title="SL")