आरएसआई पिवोट, बीबी, एसएमए, ईएमए, एसएमएमए, डब्ल्यूएमए, वीडब्ल्यूएमए के साथ विचलन
लेखक:चाओझांग, दिनांकः 2022-05-12 17:17:05टैगःएसएमएईएमएएसएमएमएडब्ल्यूएमएवीडब्ल्यूएमएबॉल
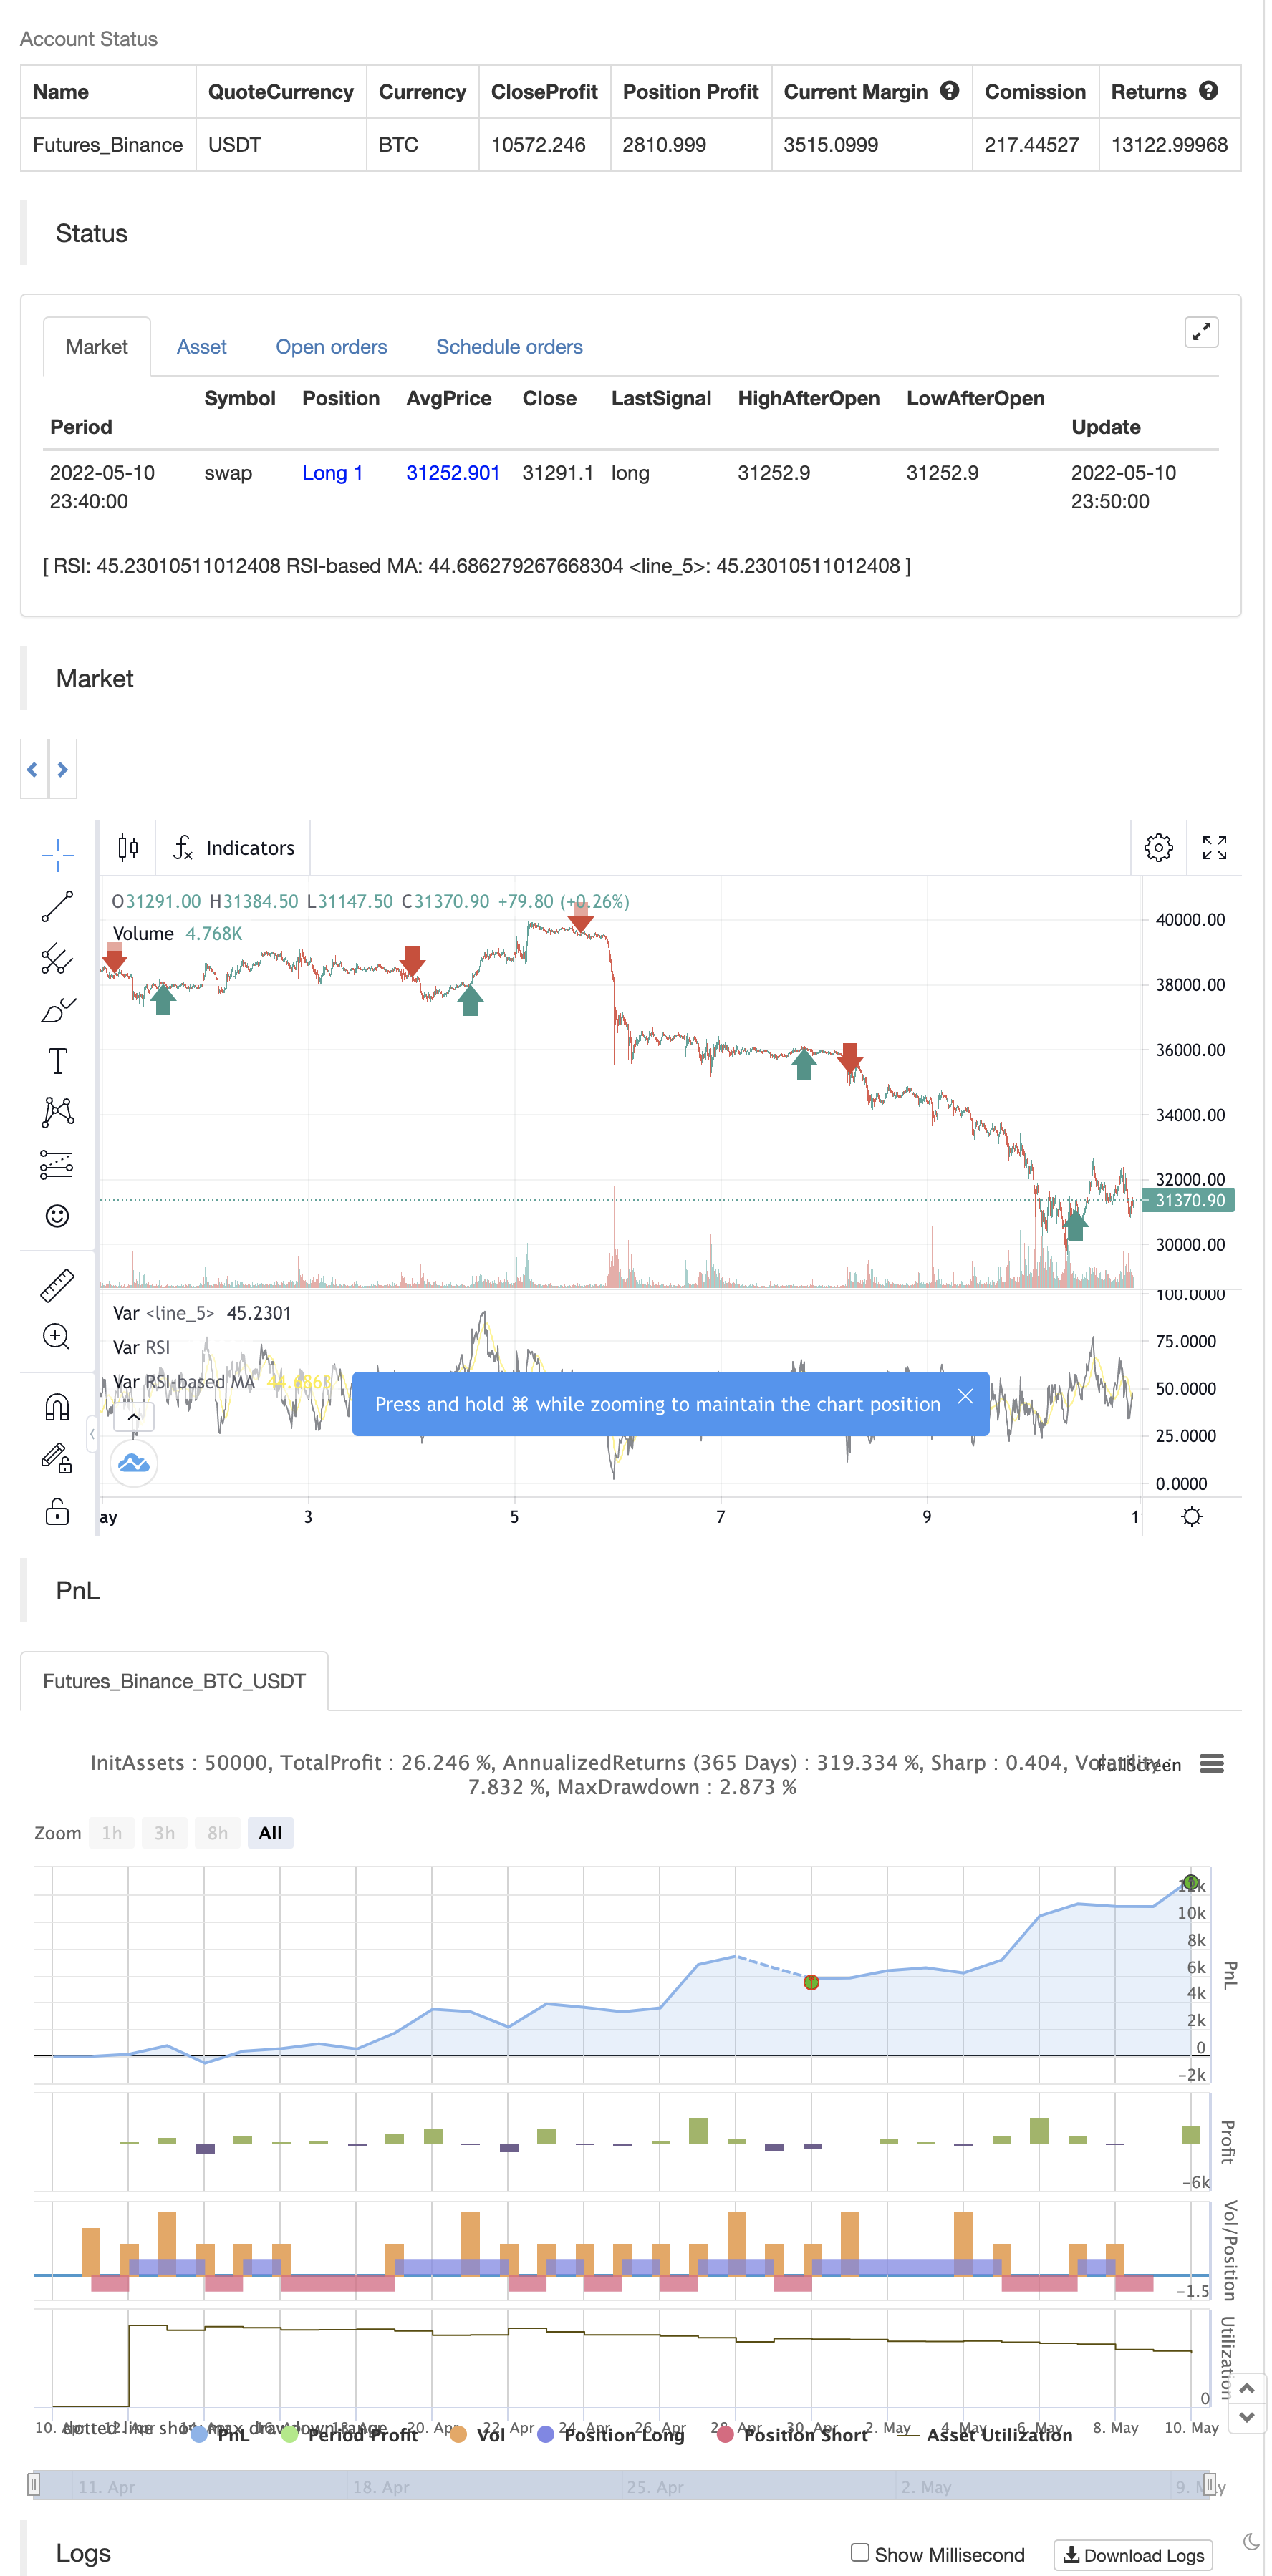
आरएसआई विचलन, बीबी, एमए कुछ उपयोगी सुविधाओं के साथ एक बुनियादी आरएसआई थरथरानवाला है, यह उपयोगकर्ता को सीधे आरएसआई संकेतक पर विचलन, पिवोट और मूविंग एवरेज प्रदर्शित करने की अनुमति देता है।
चलती औसत जो आप आरएसआई ऑसिलेटर पर प्रदर्शित कर सकते हैं वे हैंः एसएमए ईएमए एसएमएमए डब्ल्यूएमए वीडब्ल्यूएमए बोलिंगर बैंड
/*backtest
start: 2022-04-11 00:00:00
end: 2022-05-10 23:59:00
period: 10m
basePeriod: 1m
exchanges: [{"eid":"Futures_Binance","currency":"BTC_USDT"}]
*/

////////////////////////////////////////////////////////////////////////////////
//                                                                            //
//                      ====== My Crypto Succubus ======                      //
//   ====== RSI Divergence with Pivot, BB, SMA, EMA, SMMA, WMA, VWMA ======   //
//                                                                            //
////////////////////////////////////////////////////////////////////////////////
////////////////////////////////////////////////////////////////////////////////
//                                                                            //
// My Crypto Succubus is a project based on the community and  participatory  //
// aspect, knowledge sharing is the core of the project, the act of sharing   //
// is destined to get richer, either on the intellectual or the wealth        //
// side, the ultimate goal of MCS is that every single one of our members     //
// can reach the financial freedom we all deserve.                            //
//                                                                            //
//   ====== Join us on our Discord : https://discord.gg/TmW6RQeyXp  ======    //
//                                                                            //
////////////////////////////////////////////////////////////////////////////////
//@version=5
indicator(title="RSI Divergences with Pivots, BB, MA [My Crypto Succubus]", shorttitle="RSI Div, Pivot, BB, MA [My Crypto Succubus]", format=format.price, precision=2)

ma(source, length, type) =>
    switch type
        "SMA" => ta.sma(source, length)
        "Bollinger Bands" => ta.sma(source, length)
        "EMA" => ta.ema(source, length)
        "SMMA (RMA)" => ta.rma(source, length)
        "WMA" => ta.wma(source, length)
        "VWMA" => ta.vwma(source, length)

rsiLengthInput = input.int(14, minval=1, title="RSI Length", group="RSI Settings")
rsiSourceInput = input.source(close, "Source", group="RSI Settings")
maTypeInput = input.string("SMA", title="MA Type", options=["SMA", "Bollinger Bands", "EMA", "SMMA (RMA)", "WMA", "VWMA"], group="MA Settings")
maLengthInput = input.int(14, title="MA Length", group="MA Settings")
bbMultInput = input.float(2.0, minval=0.001, maxval=50, title="BB StdDev", group="MA Settings")

up = ta.rma(math.max(ta.change(rsiSourceInput), 0), rsiLengthInput)
down = ta.rma(-math.min(ta.change(rsiSourceInput), 0), rsiLengthInput)
rsi = down == 0 ? 100 : up == 0 ? 0 : 100 - (100 / (1 + up / down))
rsiMA = ma(rsi, maLengthInput, maTypeInput)
isBB = maTypeInput == "Bollinger Bands"

plot(rsi, "RSI", color=#ffffff, linewidth=1)
plot(rsiMA, "RSI-based MA", color=color.yellow)
rsiUpperBand = hline(70, "RSI Upper Band", color=#787B86)
hline(50, "RSI Middle Band", color=color.new(#787B86, 50))
rsiLowerBand = hline(30, "RSI Lower Band", color=#787B86)
fill(rsiUpperBand, rsiLowerBand, color=color.rgb(178, 8, 120, 90), title="RSI Background Fill")
bbUpperBand = plot(isBB ? rsiMA + ta.stdev(rsi, maLengthInput) * bbMultInput : na, title = "Upper Bollinger Band", color=color.green)
bbLowerBand = plot(isBB ? rsiMA - ta.stdev(rsi, maLengthInput) * bbMultInput : na, title = "Lower Bollinger Band", color=color.green)
fill(bbUpperBand, bbLowerBand, color= isBB ? color.new(color.green, 90) : na, title="Bollinger Bands Background Fill")

///////////////////////////////////////////////////////////////////////////////////////////////////////

len = input.int(14, minval=1, title='RSI Length', group="RSI Settings")
ob = input.int(defval=70, title='Overbought', minval=0, maxval=100, group="RSI Settings")
os = input.int(defval=30, title='Oversold', minval=0, maxval=100, group="RSI Settings")

// RSI code
band1 = hline(ob)
band0 = hline(os)
plot(rsi, color=rsi > ob or rsi < os ? color.rgb(255, 0, 0, 0) : color.new(color.black, 100), linewidth=1)
fill(band1, band0, color=color.new(color.purple, 97))

// DIVS code
piv = input(false, 'Hide pivots?')
shrt = input(false, 'Shorter labels?')
hidel = input(true, 'Hide labels and color background')
xbars = input.int(defval=90, title='Div lookback period (bars)?', minval=1)
hb = math.abs(ta.highestbars(rsi, xbars))  // Finds bar with highest value in last X bars
lb = math.abs(ta.lowestbars(rsi, xbars))  // Finds bar with lowest value in last X bars

// Defining variable values, mandatory in Pine 3
max = float(na)
max_rsi = float(na)
min = float(na)
min_rsi = float(na)
pivoth = bool(na)
pivotl = bool(na)
divbear = bool(na)
divbull = bool(na)

// If bar with lowest / highest is current bar, use it's value
max := hb == 0 ? close : na(max[1]) ? close : max[1]
max_rsi := hb == 0 ? rsi : na(max_rsi[1]) ? rsi : max_rsi[1]
min := lb == 0 ? close : na(min[1]) ? close : min[1]
min_rsi := lb == 0 ? rsi : na(min_rsi[1]) ? rsi : min_rsi[1]

// Compare high of current bar being examined with previous bar's high
// If curr bar high is higher than the max bar high in the lookback window range
if close > max  // we have a new high
    max := close  // change variable "max" to use current bar's high value
    max
if rsi > max_rsi  // we have a new high
    max_rsi := rsi  // change variable "max_rsi" to use current bar's RSI value
    max_rsi
if close < min  // we have a new low
    min := close  // change variable "min" to use current bar's low value
    min
if rsi < min_rsi  // we have a new low
    min_rsi := rsi  // change variable "min_rsi" to use current bar's RSI value
    min_rsi

// Finds pivot point with at least 2 right candles with lower value
pivoth := max_rsi == max_rsi[2] and max_rsi[2] != max_rsi[3] ? true : na
pivotl := min_rsi == min_rsi[2] and min_rsi[2] != min_rsi[3] ? true : na

// Detects divergences between price and indicator with 1 candle delay so it filters out repeating divergences
if max[1] > max[2] and rsi[1] < max_rsi and rsi <= rsi[1]
    divbear := true
    divbear
if min[1] < min[2] and rsi[1] > min_rsi and rsi >= rsi[1]
    divbull := true
    divbull

// Alerts
alertcondition(divbear, title='Bear div', message='Bear div')
alertcondition(divbull, title='Bull div', message='Bull div')
alertcondition(pivoth, title='Pivot high', message='Pivot high')
alertcondition(pivotl, title='Pivot low', message='Pivot low')

// Plots divergences and pivots with offest
//l = divbear ? label.new(bar_index - 1, rsi[1] + 1, 'BEAR', color=color.red, textcolor=color.white, style=label.style_label_down, yloc=yloc.price, size=size.small) : divbull ? label.new(bar_index - 1, rsi[1] - 1, 'BULL', color=color.green, textcolor=color.white, style=label.style_label_up, yloc=yloc.price, size=size.small) : pivoth ? label.new(bar_index - 2, max_rsi + 1, 'PIVOT', color=color.blue, textcolor=color.white, style=label.style_label_down, yloc=yloc.price, size=size.small) : pivotl ? label.new(bar_index - 2, min_rsi - 1, 'PIVOT', color=color.blue, textcolor=color.white, style=label.style_label_up, yloc=yloc.price, size=size.small) : na

// Shorter labels
//if shrt
//    label.set_text(l, na)
// Hides pivots or labels
//if piv and (pivoth or pivotl) or hidel
//    label.delete(l)
// Colors indicator background
//bgcolor(hidel ? divbear ? color.new(color.red, 50) : divbull ? color.new(color.green, 50) : na : na, offset=-1, transp=90)
//bgcolor(hidel ? piv ? na : pivoth or pivotl ? color.new(color.blue, 50) : na : na, offset=-2, transp=90)

// Debug tools
// plot(max, color=blue, linewidth=2)
// plot(max_rsi, color=red, linewidth=2)
// plot(hb, color=orange, linewidth=2)
// plot(lb, color=purple, linewidth=1)
// plot(min_rsi, color=lime, linewidth=1)
// plot(min, color=black, linewidth=1)

////////////////////////////////////////////////////////////////////////////////
//                                                                            //
//                      ====== My Crypto Succubus ======                      //
//   ====== RSI Divergence with Pivot, BB, SMA, EMA, SMMA, WMA, VWMA ======   //
//                                                                            //
////////////////////////////////////////////////////////////////////////////////
////////////////////////////////////////////////////////////////////////////////
//                                                                            //
// My Crypto Succubus is a project based on the community and  participatory  //
// aspect, knowledge sharing is the core of the project, the act of sharing   //
// is destined to get richer, either on the intellectual or the wealth        //
// side, the ultimate goal of MCS is that every single one of our members     //
// can reach the financial freedom we all deserve.                            //
//                                                                            //
//   ====== Join us on our Discord : https://discord.gg/TmW6RQeyXp  ======    //
//                                                                            //
////////////////////////////////////////////////////////////////////////////////

if divbear
    strategy.entry("Enter Long", strategy.long)
else if divbull
    strategy.entry("Enter Short", strategy.short)
संबंधित
- एसएसएस
- क्रॉडल का सुपरट्रेंड
- ओसीसी रणनीति आर5.1
- 2 चलती औसत रंग दिशा का पता लगाना
- वीडब्ल्यूएमए-एडीएक्स गति और ट्रेंड-आधारित बिटकॉइन लंबी रणनीति
- गति-आधारित ज़िगज़ैग
- चलती औसत और बोलिंगर बैंड पर आधारित मात्रात्मक ट्रेडिंग रणनीति
- HALFTREND + HEMA + SMA (गलत संकेत की रणनीति)
- एनर्जी बार के साथ रेडके डुअल वेडर
- चलती औसत क्रॉस अलर्ट, मल्टी टाइमफ्रेम (MTF)
अधिक
- विला डायनामिक पिवोट सुपरट्रेंड रणनीति
- क्रॉडल का सुपरट्रेंड
- zdmre द्वारा आरएसआई
- FTL - रेंज फिल्टर X2 + EMA + UO
- ब्राह्मस्त्र
- मोबो बैंड
- एसएआर + 3एसएमएमए SL और TP के साथ
- एसएसएस
- चंद्रमा प्रक्षेपण अलर्ट टेम्पलेट [सूचक]
- HALFTREND + HEMA + SMA (गलत संकेत की रणनीति)
- आरएसआई और बीबी और एक साथ ओवरसोल्ड
- रोलिंग हेकिन आशी मोमबत्तियाँ
- कॉम्बो 2/20 ईएमए और बैंडपास फ़िल्टर
- ईएसएसएमए
- 3EMA
- पिवोट ऑर्डर ब्लॉक
- NMVOB-S
- चलती औसत रंगीन ईएमए/एसएमए
- MAHL बैंड
- इस सिंगल स्क्रिप्ट में 3 सुपरट्रेंड जोड़ें