बेस्ट एग्लोविंग + ब्रेकआउट रणनीति
लेखक:चाओझांग, दिनांकः 2022-05-25 14:40:18टैगःआरएमएईएमएडब्ल्यूएमए
हैलो व्यापारियों
यह ट्रेडिंग व्यू रणनीति के लिए एक सरल एल्गोरिथ्म है जो 2 असंबद्ध संकेतकों के अभिसरण को ट्रैक करता है।
मेरी व्यापारिक समस्याओं का समाधान अभिसरण है। यह अनंत संभावनाओं और केवल कुछ कामकाजी संयोजनों के साथ एक पहेली है।
यहाँ एक है कि मुझे पसंद है
- निगलने का पैटर्न
- ब्रेकआउट का पता लगाने के लिए मूल्य बनाम चलती औसत
परिभाषा
नोटबुक निकाल लो :) और कुछ कॉफी (फोकस के लिए अच्छा है). मैं कॉफी में तेजी से हूँ
निगलने का पैटर्न दो मोमबत्तियों का उल्टा पैटर्न है।
दूसरी मोमबत्ती पूंछ की छाया की लंबाई के बावजूद पहली मोमबत्ती के वास्तविक शरीर को पूरी तरह से
तेजी का पैटर्न एक डाउनट्रेंड में दिखाई देता है और एक बड़ी हरी मोमबत्ती के बाद एक लाल मोमबत्ती का संयोजन होता है मंदी वाला एंगुल्फिंग पैटर्न एक डाउनट्रेंड में दिखाई देता है और एक बड़ी लाल मोमबत्ती के बाद एक हरी मोमबत्ती का संयोजन है।
उदाहरण:https://imgur.com/a/krDDUz4
हम ऊब गए हैं सर... इसका क्या मतलब है?
संक्षेप में, एक engulfing एक पैटर्न रिवर्स ट्रैक करने के लिए है. (पूरे ट्रेडिंगव्यू दर्शक अब खड़े हो जाओ एक खड़े हुए अभिवादन दे रहा है) मूल्य बनाम चलती औसत फ़िल्टर जोड़ने गति के साथ उलट ट्रैक करने के लिए अनुमति देता है (दर्शक का आधा गिर गया क्योंकि यह बहुत भयानक है)
ठीक है सर... आपने मेरी दिलचस्पी को उठाया
मैंने कुछ कूल बैकटेस्ट फ़िल्टर शामिल किए:
- दिनांक सीमा फ़िल्टरिंग
- यूएसडी मूल्य में लचीला लाभ (नीले रंग में चित्रित)
- यूएसडी मूल्य में लचीला स्टॉप लॉस (लाल रंग में चित्रित)
शुभकामनाएँ. डेव
बैकटेस्ट
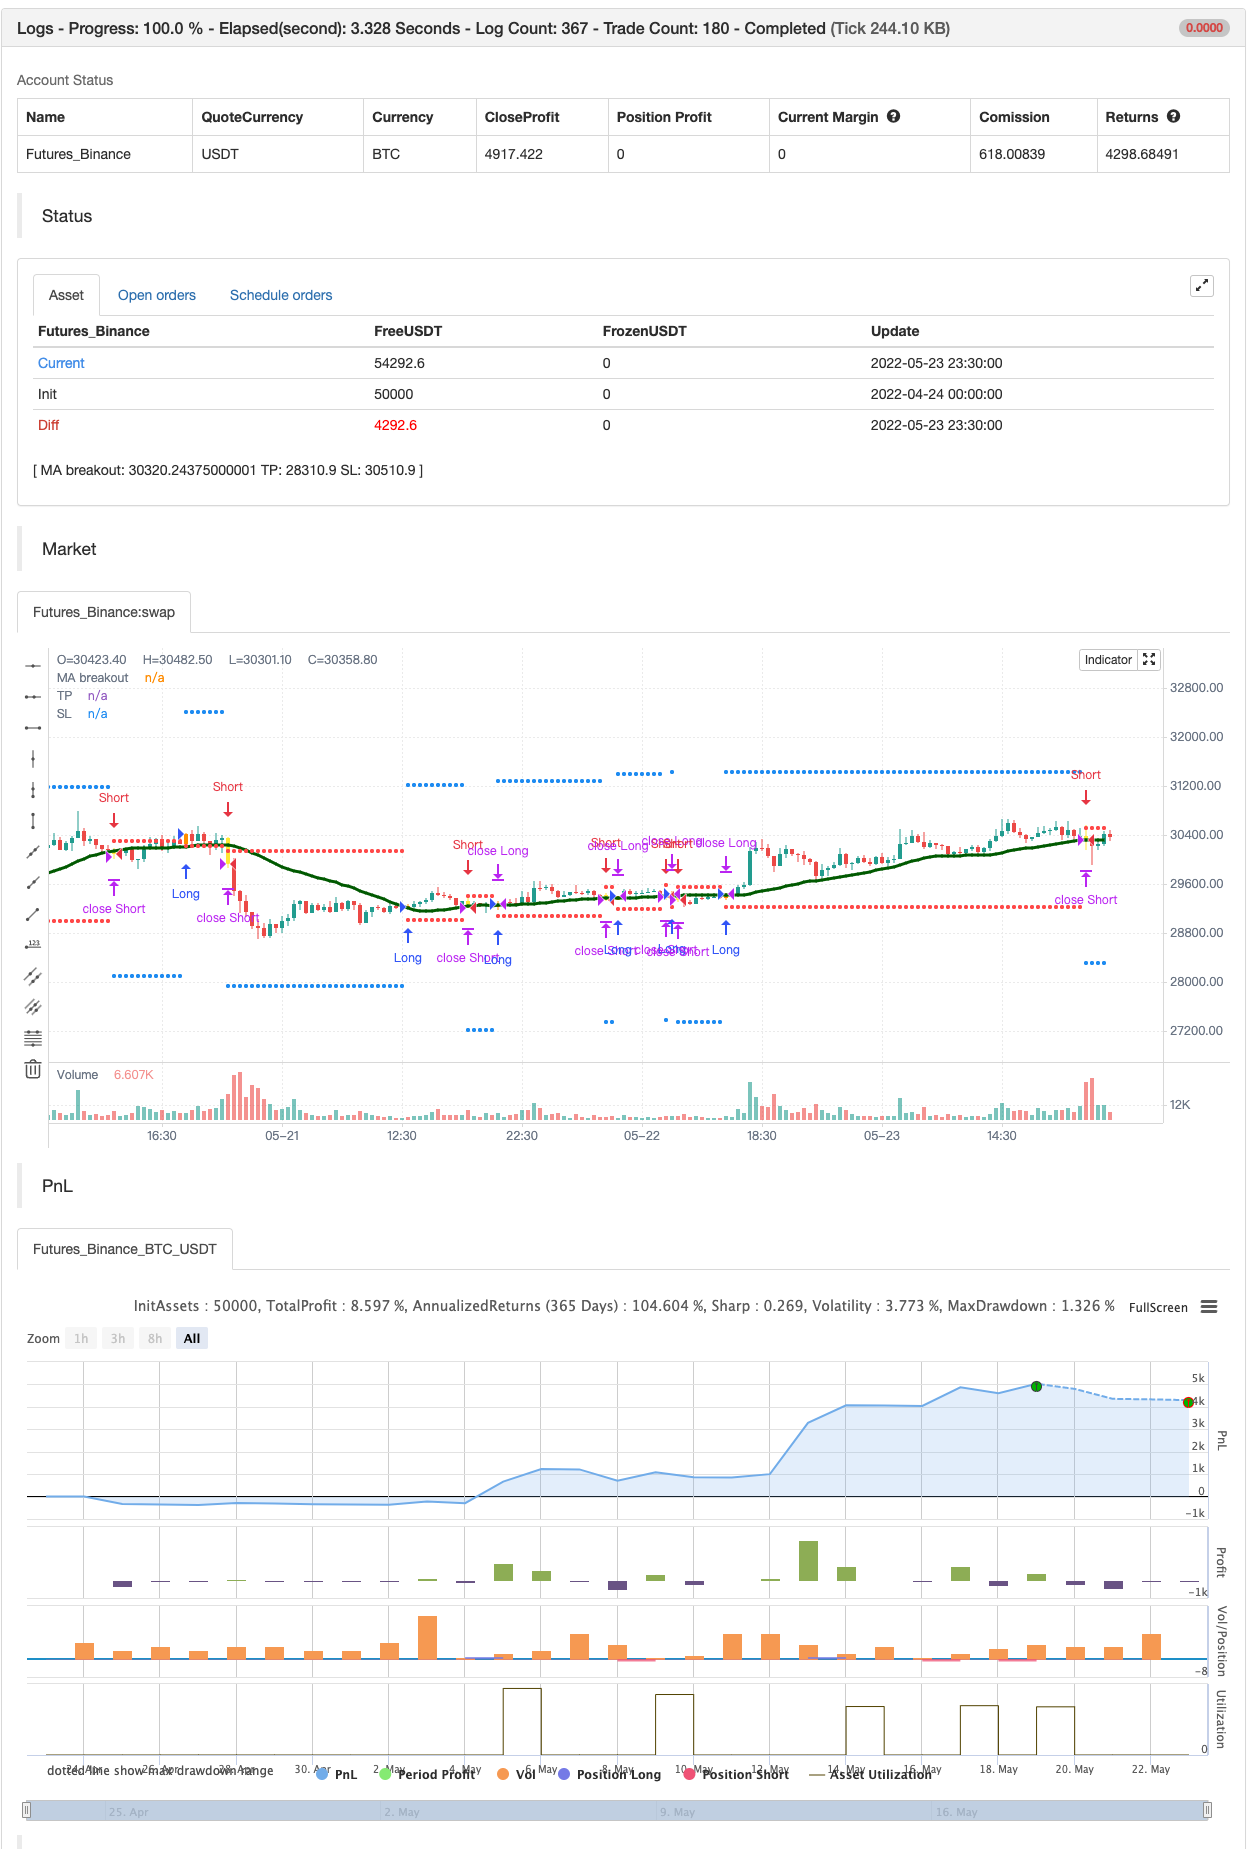
/*backtest
start: 2022-04-24 00:00:00
end: 2022-05-23 23:59:00
period: 30m
basePeriod: 15m
exchanges: [{"eid":"Futures_Binance","currency":"BTC_USDT"}]
*/

//@version=4
//@author=Daveatt

StrategyName = "BEST Engulfing + MA"
ShortStrategyName = "BEST Engulfing + MA"

strategy(title=StrategyName, shorttitle=ShortStrategyName, overlay=true,
 pyramiding=2, default_qty_value=500, precision=7, currency=currency.USD,
 commission_value=0.2,commission_type=strategy.commission.percent, initial_capital=10000)

includeEngulfing = true

includeMA = true
source_ma = input(title="Source Price vs MA", type=input.source, defval=close)
typeofMA = input(title="Type of MA", defval="SMA", options=["RMA", "SMA", "EMA", "WMA", "VWMA", "SMMA", "KMA", "TMA", "HullMA", "DEMA", "TEMA"])
length_ma = input(32, title = "MA Length", type=input.integer)

// ---------- Candle components and states
GreenCandle = close > open
RedCandle = close < open
NoBody = close==open
Body = abs(close-open)


// bullish conditions
isBullishEngulfing1 = max(close[1],open[1]) < max(close,open) and min(close[1],open[1]) > min(close,open) and Body > Body[1] and GreenCandle and RedCandle[1]
isBullishEngulfing2 = max(close[1],open[1]) < max(close,open) and min(close[1],open[1]) <= min(close,open) and Body > Body[1] and GreenCandle and RedCandle[1]

// bearish conditions
isBearishEngulfing1 = max(close[1],open[1]) < max(close,open) and min(close[1],open[1]) > min(close,open) and Body > Body[1] and RedCandle and GreenCandle[1]
isBearishEngulfing2 = max(close[1],open[1]) >= max(close,open) and min(close[1],open[1]) > min(close,open) and Body > Body[1] and RedCandle and GreenCandle[1]

// consolidation of conditions
isBullishEngulfing = isBullishEngulfing1 or isBullishEngulfing2
isBearishEngulfing = isBearishEngulfing1 or isBearishEngulfing2

//isBullishEngulfing = max(close[1],open[1]) < max(close,open) and min(close[1],open[1]) > min(close,open) and Body > Body[1] and GreenCandle and RedCandle[1]
//isBearishEngulfing = max(close[1],open[1]) < max(close,open) and min(close[1],open[1]) > min(close,open) and Body > Body[1] and RedCandle and GreenCandle[1]

Engulf_curr = 0 - barssince(isBearishEngulfing) + barssince(isBullishEngulfing)
Engulf_Buy = Engulf_curr < 0 ? 1 : 0
Engulf_Sell = Engulf_curr > 0 ? 1 : 0


// Price vs MM


smma(src, len) =>
    smma = 0.0
    smma := na(smma[1]) ? sma(src, len) : (smma[1] * (len - 1) + src) / len
    smma

ma(smoothing, src, length) =>
    if smoothing == "RMA"
        rma(src, length)
    else
        if smoothing == "SMA"
            sma(src, length)
        else
            if smoothing == "EMA"
                ema(src, length)
            else
                if smoothing == "WMA"
                    wma(src, length)
				else
					if smoothing == "VWMA"
						vwma(src, length)
					else
						if smoothing == "SMMA"
						    smma(src, length)
						else
							if smoothing == "HullMA"
								wma(2 * wma(src, length / 2) - wma(src, length), round(sqrt(length)))
							else
								if smoothing == "LSMA"
									src
								else
								    if smoothing == "KMA"
								        xPrice = src
                                        xvnoise = abs(xPrice - xPrice[1])
                                        nfastend = 0.666
                                        nslowend = 0.0645
                                        nsignal = abs(xPrice - xPrice[length])
                                        nnoise = sum(xvnoise, length)
                                        nefratio = iff(nnoise != 0, nsignal / nnoise, 0)
                                        nsmooth = pow(nefratio * (nfastend - nslowend) + nslowend, 2)
                                        nAMA = 0.0
                                        nAMA := nz(nAMA[1]) + nsmooth * (xPrice - nz(nAMA[1]))
                                        nAMA
								    else
								        if smoothing == "TMA"
									        sma(sma(close, length), length)
						                else
							                if smoothing == "DEMA"
							                    2 * src - ema(src, length)
							                else
							                    if smoothing == "TEMA"
							                        3 * (src - ema(src, length)) + ema(ema(src, length), length)
							                    else
		    							            src


MA = ma(typeofMA, source_ma, length_ma)

plot(MA, color=#006400FF, title="MA breakout", linewidth=3)

macrossover  = crossover (source_ma, MA)
macrossunder = crossunder(source_ma, MA)

since_ma_buy = barssince(macrossover)
since_ma_sell = barssince(macrossunder)
macross_curr = 0 - since_ma_sell + since_ma_buy
bullish_MA_cond = macross_curr < 0 ?  1 : 0
bearish_MA_cond = macross_curr > 0 ? 1  : 0

posUp = (Engulf_Buy ? 1 : 0) + (bullish_MA_cond ? 1 : 0)
posDn = (Engulf_Sell ? 1 : 0) + (bearish_MA_cond ? 1 : 0)

conditionUP = posUp == 2 and posUp[1] < 2
conditionDN = posDn == 2 and posDn[1] < 2


sinceUP = barssince(conditionUP)
sinceDN = barssince(conditionDN)

// primary-first signal of the trend
nUP = crossunder(sinceUP,sinceDN)
nDN = crossover(sinceUP,sinceDN)


// and the following secondary signals

// save of the primary signal
sinceNUP = barssince(nUP)
sinceNDN = barssince(nDN)

buy_trend   = sinceNDN > sinceNUP
sell_trend  = sinceNDN < sinceNUP

// engulfing by
barcolor(nUP ? color.orange : na, title="Bullish condition")
barcolor(nDN ? color.yellow : na, title="Bearish condition")

isLong  = nUP
isShort = nDN

long_entry_price    = valuewhen(nUP, close, 0)
short_entry_price   = valuewhen(nDN, close, 0)

longClose   = close[1] < MA
shortClose  = close[1] > MA

///////////////////////////////////////////////
//* Backtesting Period Selector | Component *//
///////////////////////////////////////////////


StartYear = input(2017, "Backtest Start Year",minval=1980)
StartMonth = input(1, "Backtest Start Month",minval=1,maxval=12)
StartDay = input(1, "Backtest Start Day",minval=1,maxval=31)
testPeriodStart = timestamp(StartYear,StartMonth,StartDay,0,0)

StopYear = input(2020, "Backtest Stop Year",minval=1980)
StopMonth = input(12, "Backtest Stop Month",minval=1,maxval=12)
StopDay = input(31, "Backtest Stop Day",minval=1,maxval=31)
testPeriodStop = timestamp(StopYear,StopMonth,StopDay,0,0)

testPeriod() => true


//////////////////////////
//* Profit Component *//
//////////////////////////

input_tp_pips = input(2000, "Backtest Profit Goal (in USD)",minval=0)
input_sl_pips = input(200, "Backtest STOP Goal (in USD)",minval=0)


tp = buy_trend? long_entry_price + input_tp_pips : short_entry_price - input_tp_pips
sl = buy_trend? long_entry_price - input_sl_pips : short_entry_price + input_sl_pips


long_TP_exit  = buy_trend and high >= tp
short_TP_exit = sell_trend and low <= tp

plot(tp, title="TP", style=plot.style_circles, linewidth=3, color=color.blue)
plot(sl, title="SL", style=plot.style_circles, linewidth=3, color=color.red)

if testPeriod()
    strategy.entry("Long", 1, when=isLong)
    strategy.close("Long", when=longClose )
    strategy.exit("XL","Long", limit=tp,  when=buy_trend, stop=sl)


if testPeriod()
    strategy.entry("Short", 0,  when=isShort)
    strategy.close("Short", when=shortClose )
    strategy.exit("XS","Short", when=sell_trend, limit=tp, stop=sl)
- इंद्रधनुष दोलन
- सुपर स्केलर
- सुपरजंप टर्न बैक बोलिंगर बैंड
- ईएसएसएमए
- स्मार्ट एमएसीडी
- सुपर स्केलर - 5 मिनट 15 मिनट
- खरीद/बिक्री के साथ ईएमए एडीएक्स आरएसआई का स्केलिंग
- गति-आधारित ज़िगज़ैग
- वीडब्ल्यूएमए-एडीएक्स गति और ट्रेंड-आधारित बिटकॉइन लंबी रणनीति
- विलियम्स %R - चिकनी
- पिवोट आधारित अनुवर्ती अधिकतम और न्यूनतम
- निक राइपॉक ट्रैलिंग रिवर्स (एनआरटीआर)
- ज़िगज़ैग पीए रणनीति V4.1
- दिन के भीतर खरीद/बिक्री
- टूटा हुआ फ्रैक्टल: किसी के टूटे हुए सपने से आपका लाभ होता है!
- मुनाफा अधिकतम करनेवाला PMax
- निर्दोष विजय रणनीति
- स्टोकैस्टिक + आरएसआई, डबल रणनीति
- स्विंग हॉल/आरएसआई/ईएमए रणनीति
- स्केलिंग स्विंग ट्रेडिंग टूल R1-4
- Bollinger भयानक चेतावनी R1
- बहु-विनिमय प्लगइन
- त्रिभुज लाभ (छोटी मुद्राओं के बाजार मूल्य में अंतर)
- बाइट रिवर्स कॉन्ट्रैक्ट डायनेमिक ग्रिड (विशेष ग्रिड)
- MT4 MT5 + गतिशील चर के लिए ट्रेडिंगव्यू अलर्ट
- मैट्रिक्स श्रृंखला
- सुपर स्केलर - 5 मिनट 15 मिनट
- सापेक्ष शक्ति सूचकांक - भिन्नताएं - लिबर्टस
- रैखिक प्रतिगमन ++
- एनर्जी बार के साथ रेडके डुअल वेडर