कई मूविंग एवरेज, आरएसआई और मानक विचलन निकास के साथ कैंडलस्टिक ऊंचाई ब्रेकआउट ट्रेडिंग रणनीति
रणनीति अवलोकन
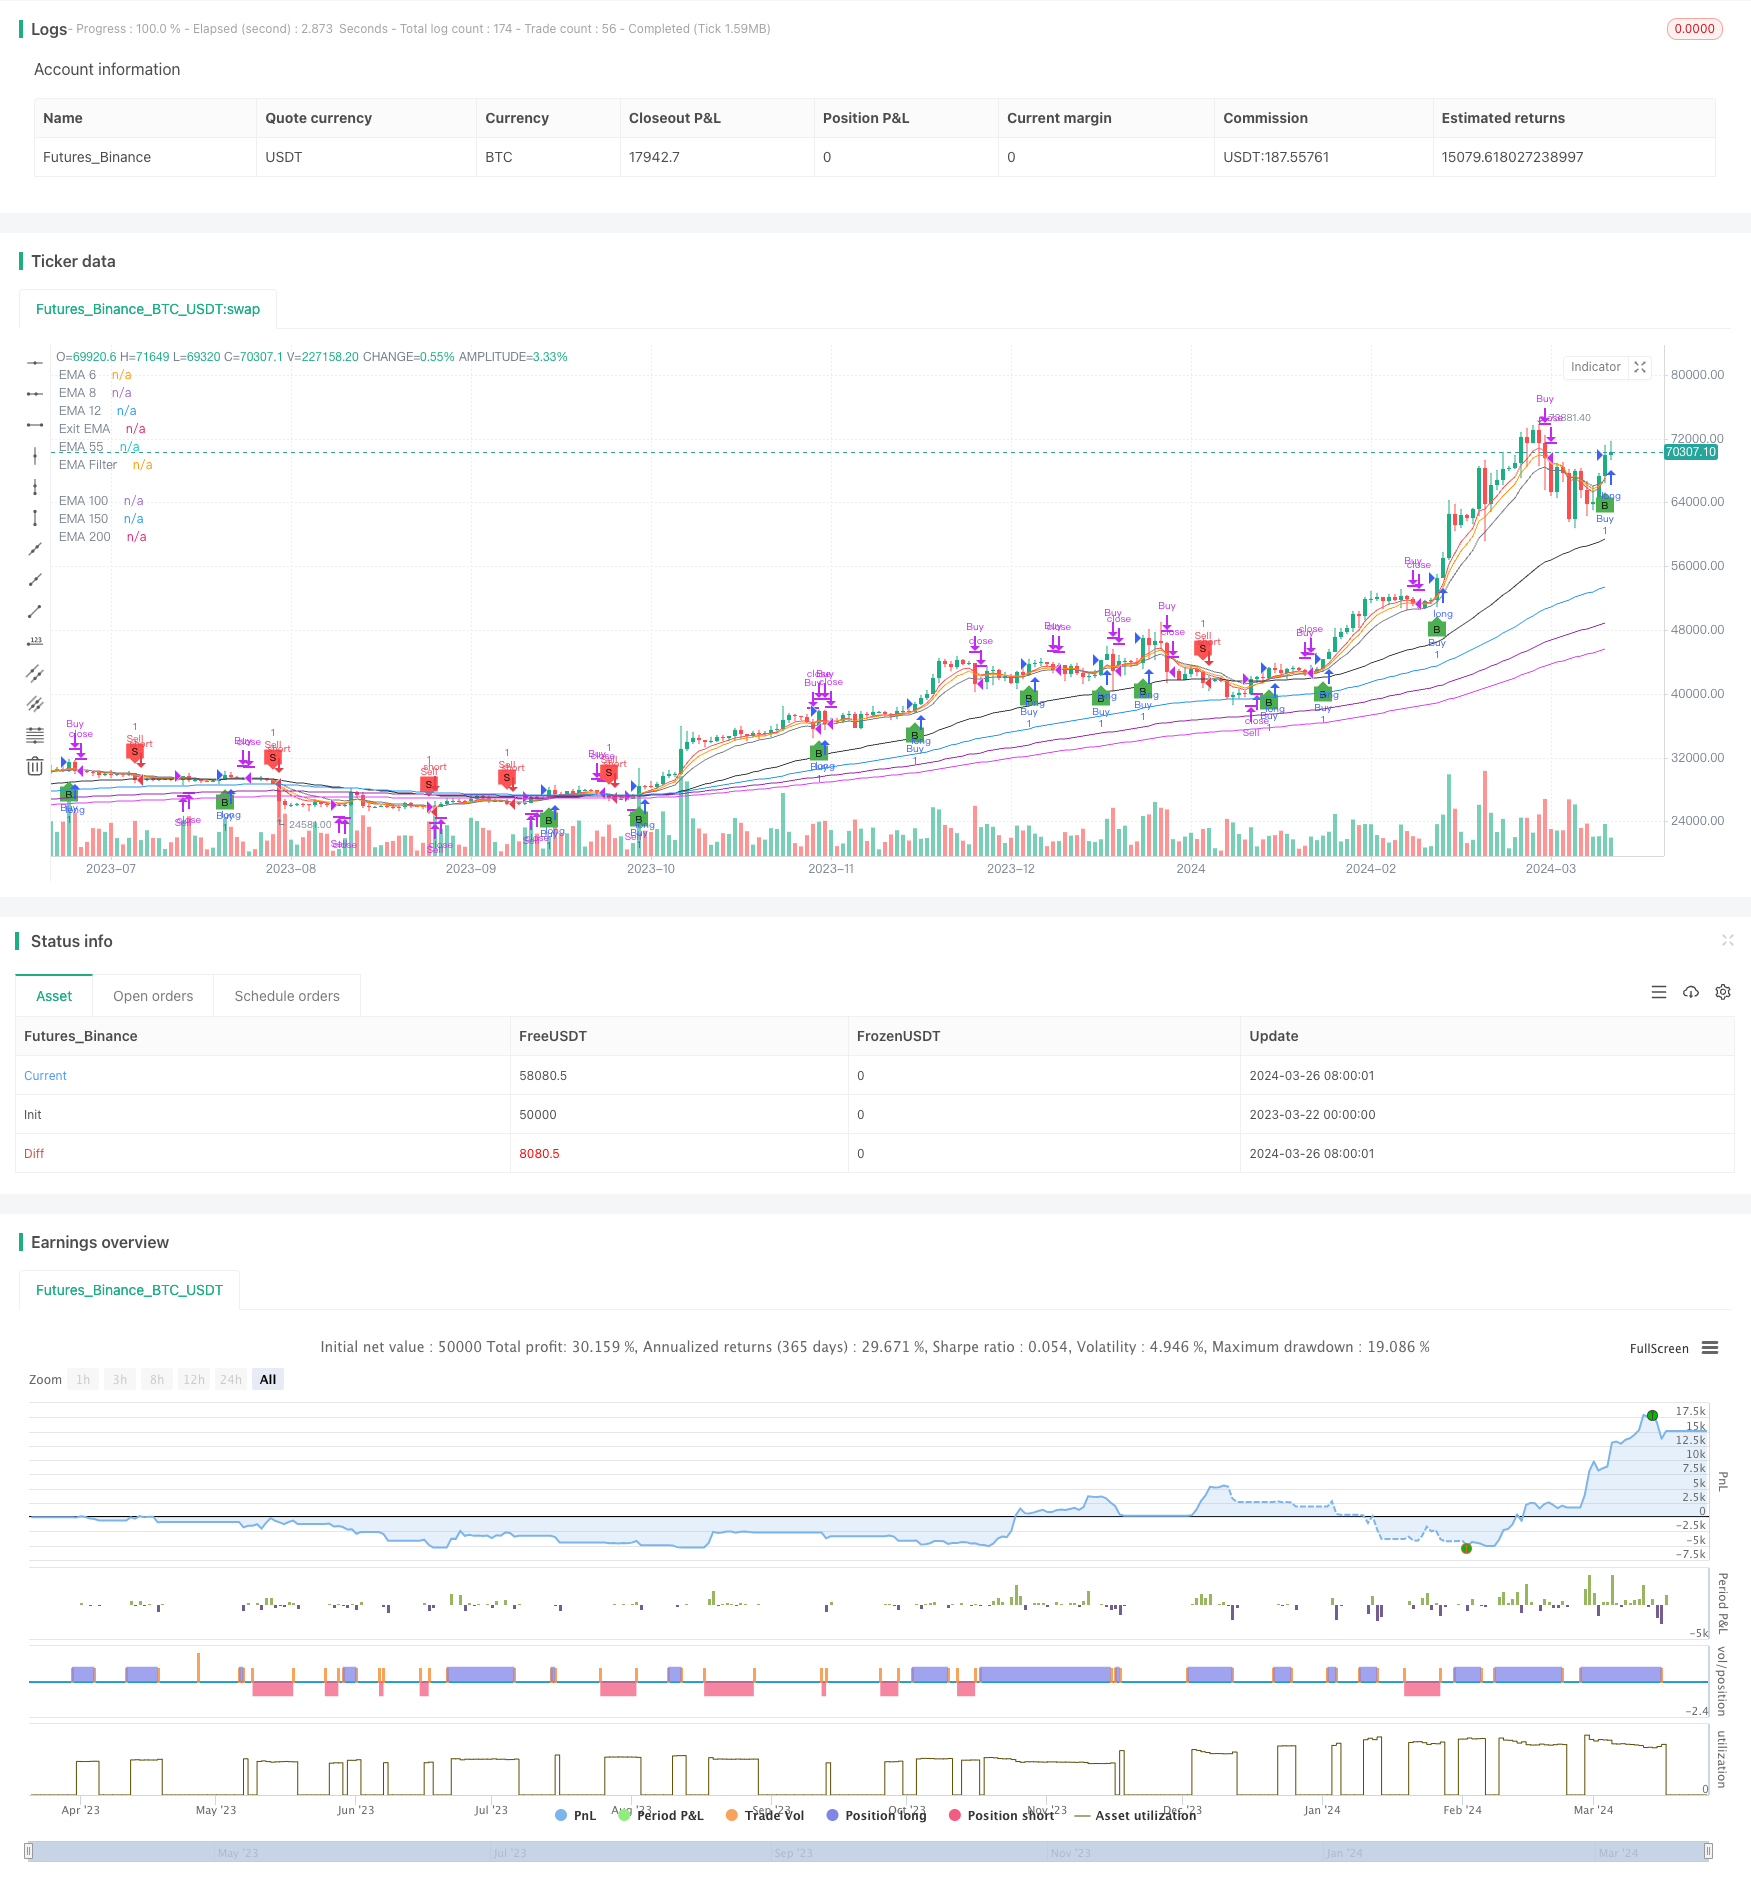
यह रणनीति कई सूचकांक चलती औसत (ईएमए), अपेक्षाकृत मजबूत सूचकांक (आरएसआई) और मानक विचलन पर आधारित आउटरीच स्थितियों के संयोजन के साथ संभावित खरीद और बिक्री के अवसरों की पहचान करती है। यह बाजार की दिशा और ताकत का विश्लेषण करने के लिए अल्पकालिक (6,8,12 दिन), मध्यम (55 दिन) और दीर्घकालिक (150-200,250 दिन) ईएमए का उपयोग करता है। आरएसआई विन्यास योग्य खरीद (३०) और बेच (७०) थ्रेशोल्ड का उपयोग करके गतिशीलता का आकलन करता है और ओवरबॉट या ओवरसोल्ड की स्थिति की पहचान करता है। यह रणनीति एक अद्वितीय आउटरीच तंत्र का भी उपयोग करती है, जो एक संभावित सुरक्षा या लाभ हानि को कम करने का एक तरीका प्रदान करता है जब समापन मूल्य 12 वीं ईएमए के विन्यास योग्य मानक विचलन (मौखिक 0.5) के दायरे को छूता है।
रणनीति सिद्धांत
- EMA की गणना करें (6, 8, 12, 55, 100, 150, 200) दृश्य संदर्भ के रूप में, बाजार की प्रवृत्ति का आकलन करने के लिए।
- हाल ही में N रूट के लिए उच्चतम और निम्नतम कीमतों की गणना करें।
- खरीद की शर्तेंः वर्तमान समापन मूल्य हाल ही में N रूट लाइन के उच्चतम मूल्य से अधिक है और ईएमए फ़िल्टर से अधिक है (यदि सक्षम है) ।
- बिक्री की शर्तेंः वर्तमान समापन मूल्य हाल ही में N रूट लाइन के न्यूनतम मूल्य से कम है, और ईएमए फ़िल्टर से कम है (यदि सक्षम है) ।
- लॉन्ग पोजीशन आउटरीच की शर्तेंः वर्तमान समापन मूल्य 12 दिन ईएमए + 0.5 गुना मानक अंतर से कम है, या 12 दिन ईएमए से कम है।
- शॉर्ट पोजीशन आउटरीच की शर्तेंः वर्तमान समापन मूल्य 12 वें ईएमए से अधिक है - 0.5 गुना मानक अंतर, या 12 वें ईएमए से अधिक है।
- आरएसआई का उपयोग एक सहायक संकेतक के रूप में किया जाता है, डिफ़ॉल्ट चक्र 14 है, ओवरबोर्ड 30 है, और ओवरबोर्ड 70 है।
रणनीतिक लाभ
- ट्रेंड ट्रैकिंग (मल्टीपल ईएमए) और गतिशीलता (आरएसआई) के दो आयामों को मिलाकर, यह एक अधिक व्यापक बाजार विश्लेषण दृष्टिकोण प्रदान करता है।
- स्टैंडर्ड डिफरेंस पर आधारित एक अनूठा आउट-ऑफ-मेकानिज्म, जो मुनाफे की रक्षा और जोखिम को नियंत्रित करने के बीच संतुलन बनाता है।
- कोड मॉड्यूलर है, कुंजी पैरामीटर उपयोगकर्ता द्वारा कॉन्फ़िगर किया जा सकता है, लचीला है।
- विभिन्न प्रकारों और समय अवधि के लिए उपयुक्त, विशेष रूप से स्टॉक और बिटकॉइन ट्रेडिंग के लिए।
जोखिम विश्लेषण
- बाजार में उतार-चढ़ाव के दौरान या रुझान में बदलाव के शुरुआती दिनों में, अक्सर झूठे संकेत दिखाई देते हैं, जिससे लगातार नुकसान होता है।
- डिफ़ॉल्ट पैरामीटर सभी बाजार स्थितियों के लिए काम नहीं करते हैं।
- इस रणनीति के आधार पर ट्रेडिंग करना जोखिम भरा है, अन्य संकेतकों के साथ संयोजन में सहायक निर्णय लेने की सिफारिश की जाती है, जैसे कि प्रतिरोध स्तर का समर्थन करना।
- इस घटना के बाद से, लोगों ने इस बात पर ध्यान नहीं दिया है कि वे किस तरह की प्रतिक्रिया दे रहे हैं, लेकिन वे इस बात पर ध्यान दे रहे हैं कि वे किस तरह से प्रतिक्रिया दे रहे हैं।
अनुकूलन दिशा
- ईएमए और आरएसआई पैरामीटर का अनुकूलन करेंः विभिन्न प्रकार, चक्र और बाजार विशेषताओं के आधार पर पैरामीटर के संयोजनों के लिए सबसे अच्छा पैरामीटर रेंज खोजने के लिए प्रयास करें।
- स्टॉप-स्टॉप मैकेनिज्म को शामिल करेंः एटीआर जैसे अस्थिरता के संकेतकों का संदर्भ लें, उचित स्टॉप और स्टॉप स्थान सेट करें, एकल-व्यापार जोखिम को नियंत्रित करें।
- पोजीशन मैनेजमेंट शुरू करेंः रुझान की ताकत के आधार पर पोजीशन का आकार समायोजित करें (जैसे ADX) या महत्वपूर्ण समर्थन प्रतिरोध बिंदु से दूर।
- अन्य तकनीकी संकेतकों के साथ संयोजन में उपयोग किया जाता है, जैसे कि ब्रिन बैंड, एमएसीडी, समानांतर क्रॉसिंग, आदि।
- बाजार की स्थिति का अनुकूलनः विभिन्न बाजार स्थितियों जैसे कि रुझान, उतार-चढ़ाव और मोड़ के लिए पैरामीटर का एक संयोजन अनुकूलित करें।
संक्षेप
इस आलेख में एक बहु-चलती औसत, आरएसआई और मानक विचलन आउटपुट पर आधारित एक उच्च-ब्रेकिंग ट्रेडिंग रणनीति प्रस्तुत की गई है। यह रणनीति प्रवृत्ति और गतिशीलता के दो आयामों से बाजार का विश्लेषण करती है, और एक अद्वितीय मानक विचलन आउटपुट तंत्र का उपयोग करती है, जो प्रवृत्ति के अवसरों को पकड़ने के साथ-साथ जोखिम नियंत्रण को नियंत्रित करती है। रणनीति स्पष्ट है, तर्कसंगत है, और कोड सरल और कुशल है।
/*backtest
start: 2023-03-22 00:00:00
end: 2024-03-27 00:00:00
period: 1d
basePeriod: 1h
exchanges: [{"eid":"Futures_Binance","currency":"BTC_USDT"}]
*/

//@version=5
strategy("Candle Height Breakout with Configurable Exit and Signal Control", shorttitle="CHB Single Signal", overlay=true)

// Input parameters for EMA filter and its length
useEmaFilter = input.bool(true, "Use EMA Filter", group="Entry Conditions")
emaFilterLength = input.int(55, "EMA Filter Length", minval=1, group="Entry Conditions")
candleCount = input.int(4, "SamG Configurable Candle Count for Entry", minval=3, maxval=4, step=1, group="Entry Conditions")
exitEmaLength = input.int(12, "Exit EMA Length", minval=1, group="Exit Conditions", defval=12)
exitStdDevMultiplier = input.float(0.5, "Exit Std Dev Multiplier", minval=0.1, maxval=2.0, step=0.1, group="Exit Conditions")

// State variables to track if we are in a long or short position
var bool inLong = false
var bool inShort = false

// Calculating EMAs with fixed periods for visual reference
ema6 = ta.ema(close, 6)
ema8 = ta.ema(close, 8)
ema12 = ta.ema(close, 12)
ema55 = ta.ema(close, 55)
ema100 = ta.ema(close, 100)
ema150 = ta.ema(close, 150)
ema200 = ta.ema(close, 200)
emaFilter = ta.ema(close, emaFilterLength)
exitEma = ta.ema(close, exitEmaLength)

// Plotting EMAs
plot(ema6, "EMA 6", color=color.red)
plot(ema8, "EMA 8", color=color.orange)
plot(ema12, "EMA 12", color=color.yellow)
plot(ema55, "EMA 55", color=color.green)
plot(ema100, "EMA 100", color=color.blue)
plot(ema150, "EMA 150", color=color.purple)
plot(ema200, "EMA 200", color=color.fuchsia)
plot(emaFilter, "EMA Filter", color=color.black)
plot(exitEma, "Exit EMA", color=color.gray)

// Calculating the highest and lowest of the last N candles based on user input
highestOfN = ta.highest(high[1], candleCount)
lowestOfN = ta.lowest(low[1], candleCount)

// Entry Conditions with EMA Filter
longEntryCondition = not inLong and not inShort and (close > highestOfN) and (not useEmaFilter or (useEmaFilter and close > emaFilter))
shortEntryCondition = not inLong and not inShort and (close < lowestOfN) and (not useEmaFilter or (useEmaFilter and close < emaFilter))

// Update position state on entry
if (longEntryCondition)
    strategy.entry("Buy", strategy.long, comment="B")
    inLong := true
    inShort := false

if (shortEntryCondition)
    strategy.entry("Sell", strategy.short, comment="S")
    inLong := false
    inShort := true

// Exit Conditions based on configurable EMA and Std Dev Multiplier
smaForExit = ta.sma(close, exitEmaLength)
upperExitBand = smaForExit + exitStdDevMultiplier * ta.stdev(close, exitEmaLength)
lowerExitBand = smaForExit - exitStdDevMultiplier * ta.stdev(close, exitEmaLength)

exitConditionLong = inLong and (close < upperExitBand or close < exitEma)
exitConditionShort = inShort and (close > lowerExitBand or close > exitEma)

// Strategy exits
if (exitConditionLong)
    strategy.close("Buy", comment="Exit")
    inLong := false

if (exitConditionShort)
    strategy.close("Sell", comment="Exit")
    inShort := false

// Visualizing entry and exit points
plotshape(series=longEntryCondition, style=shape.labelup, location=location.belowbar, color=color.green, size=size.tiny, title="Buy Signal", text="B")
plotshape(series=shortEntryCondition, style=shape.labeldown, location=location.abovebar, color=color.red, size=size.tiny, title="Sell Signal", text="S")