Tom DeMark Peta Panas Berurutan
Penulis:ChaoZhang, Tanggal: 2022-05-08 17:19:47Tag:Tren
Indikator ini menggunakan Tom DeMark's TD Sequential counting dari 1 sampai 13.
Angka 9 dan 13 biasanya mengidentifikasi tren yang habis dan menandai pembalikan tren.
Angka-angka penting ditampilkan sebagai label (7-13), di mana 9 dan 13 disorot sebagai
Selain angka, lilin harga berwarna berdasarkan urutan. Warna bullish mulai dari kuning terang (TD 1 = awal tren) ke merah gelap (TD 13 = tren habis) Warna bearish mulai dari biru terang (TD 1 = awal tren) ke biru gelap (TD 13 = tren habis)
DeMark merekomendasikan untuk digunakan untuk pembalikan harga jangka pendek saja tapi seperti yang Anda lihat di grafik, itu juga bekerja untuk grafik LUNA 1D. Juga bekerja dengan baik dengan Heikin Ashi lilin.
Gunakan dalam kombinasi dengan misalnya
Jika Anda memiliki ide tentang bagaimana untuk mengoptimalkan kode, jangan ragu untuk berbagi
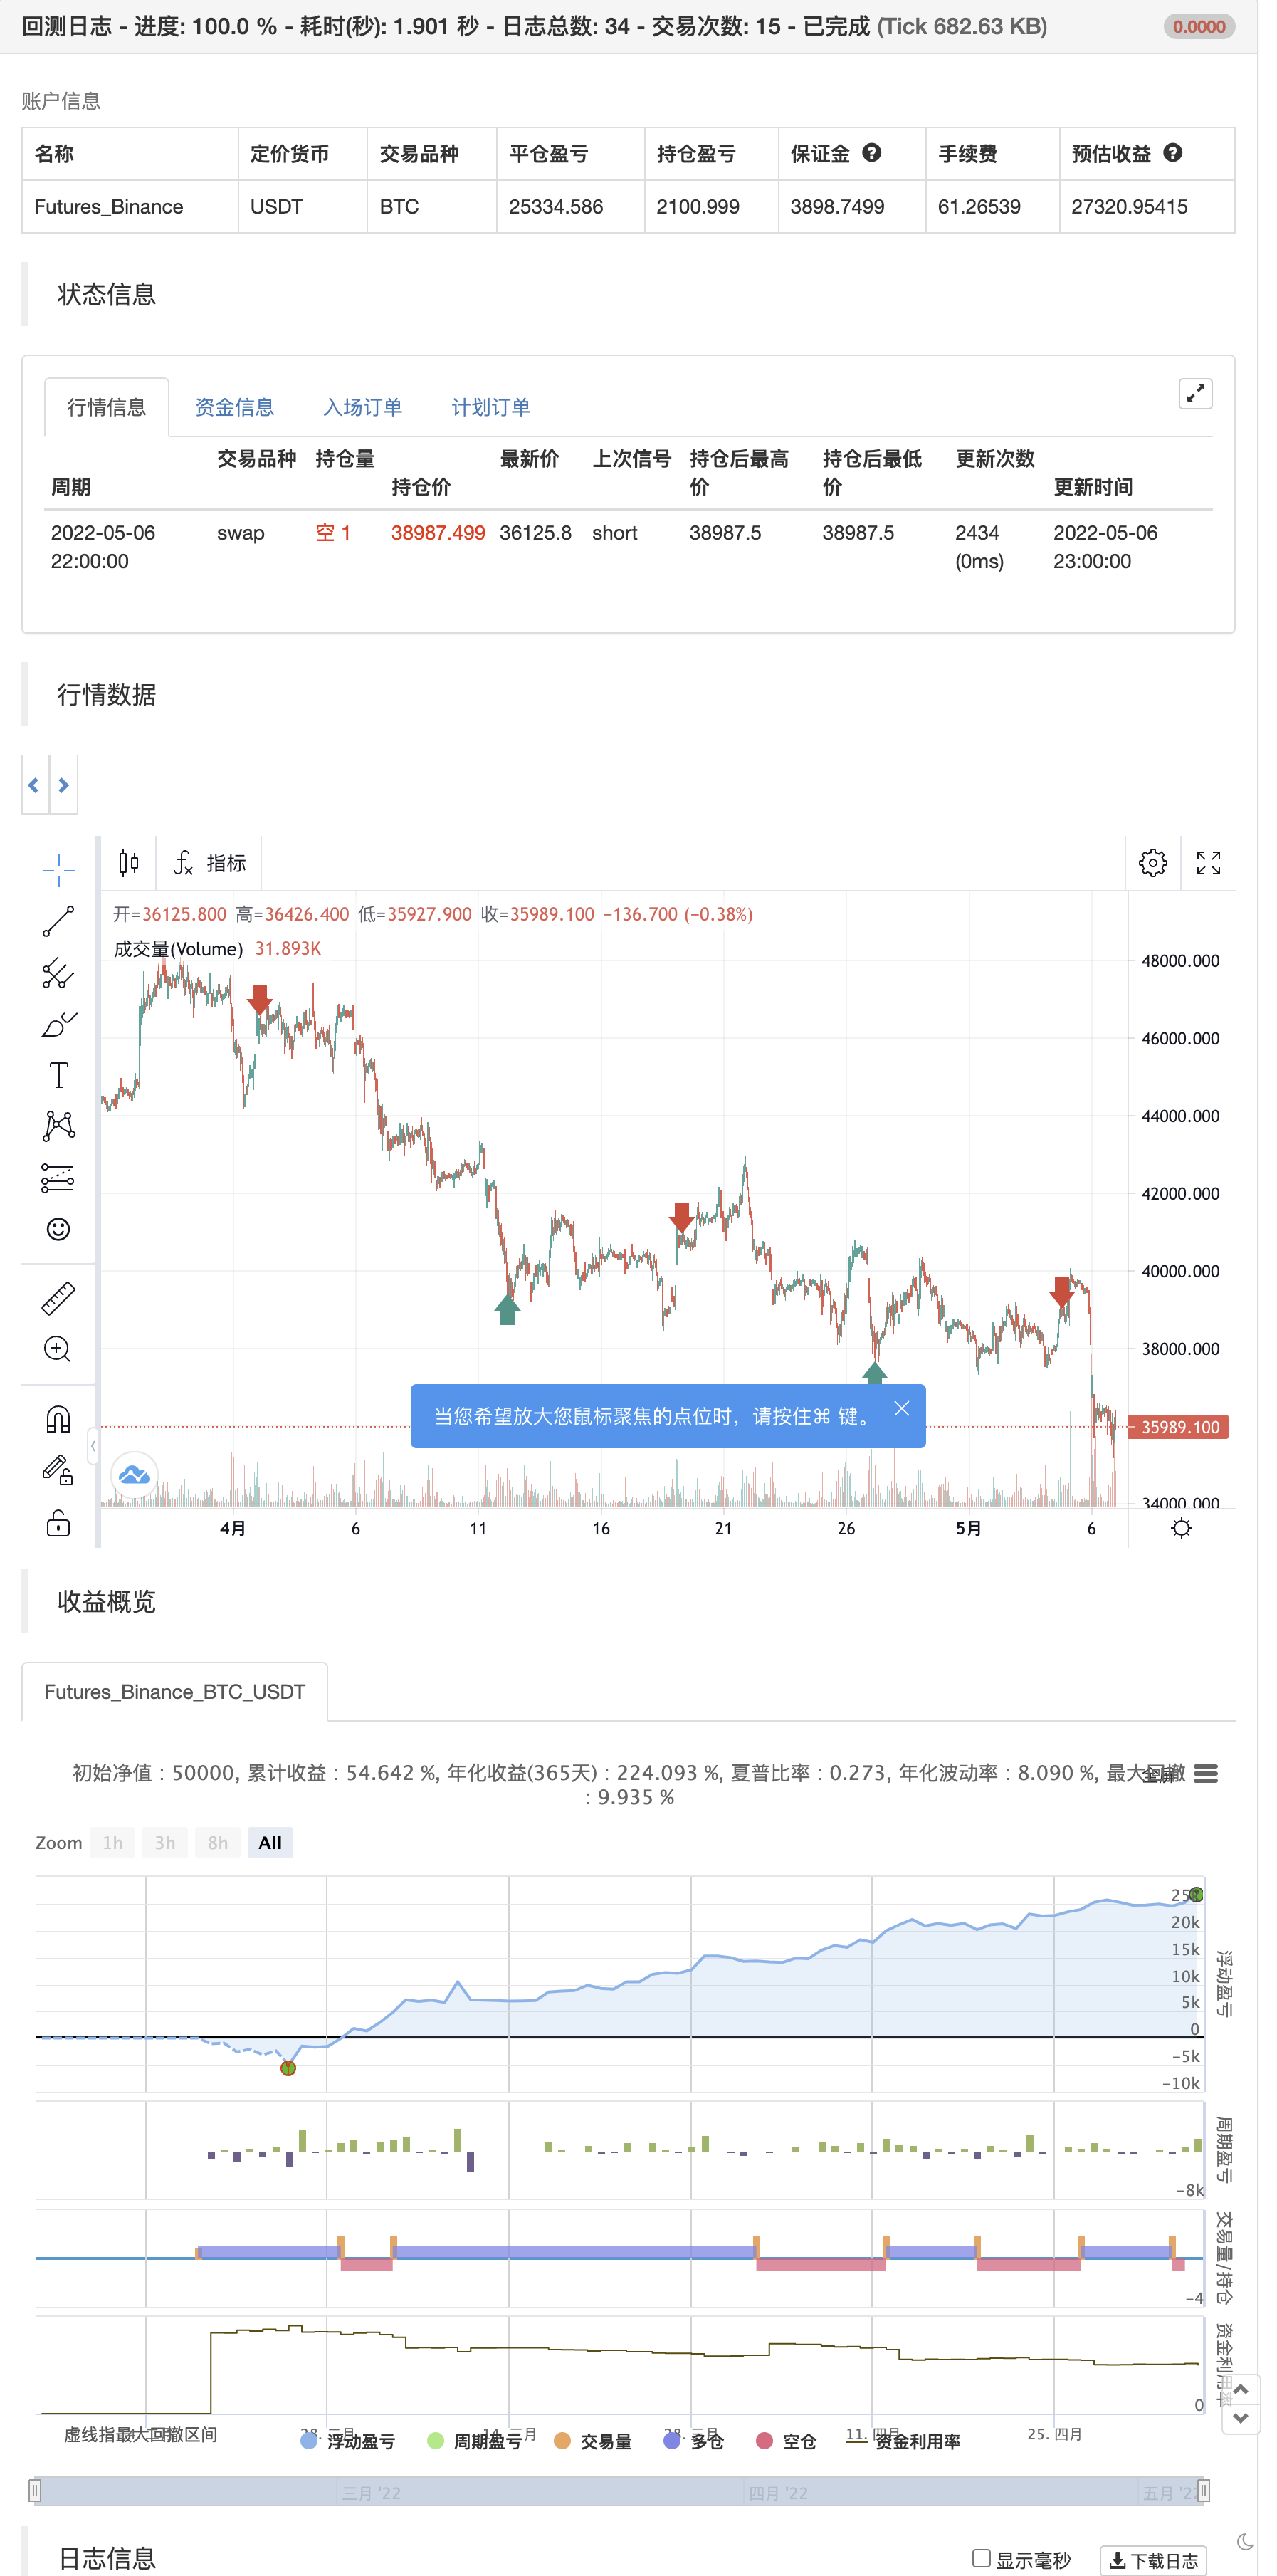
backtest
////////////////////////////////////////// Tom DeMark heatmap © by Indicator-Jones /////////////////////////////////////////
//
// This indicator uses Tom DeMark’s TD Sequential counting from 1 to 13.
// Number 9 and 13 usually identify an exhausted trend and mark trend reversal.
// The important numbers get displayed as labels (7-13), where 9 and 13 are both highlighted as "Long" or "Short".
// Besides the numbers the price candles are colored based upon the sequence.
// Bullish colors are starting from bright yellow (TD 1 = start of trend) to dark red (TD 13 = trend exhausted)
// Bearish colors are starting from bright blue (TD 1 = start of trend) to dark blue (TD 13 = trend exhausted)
//
// DeMark recommends to be used for short term price reversals only but as you can see in the chart, it also works for LUNA 1D chart.
// Also works very well with Heikin Ashi candles.
// Use it in combination with for example the "Tom DeMark Pressure Ratio" to find tops and bottoms.
// You can change the timeframes, disable lables/barcolor and customise colors to your liking.
//
// If you have any idea on how to optimise the code, please feel free to share :)
//
// Inspired by "Stochastic Heat Map" from @Violent
//
////////////////////////////////////////////////////////////////////////////////////////////////////////////////////////////

//@version=5
indicator(title='Tom DeMark Sequential Heat Map', shorttitle='TD heatmap', overlay=true, timeframe='')
//A heat map for TD counts. If you find this useful or yank the code, please consider a donation :)

// -------- Inputs --------
paintBars = input(title='Paint Bars', defval=true)
showLabels = input(title='Show labels', defval=true)

buy_col = input(#32CD32,0,'Colors',inline='col')
sell_col = input(#F44336,0,'',inline='col')
text_col = input(#FFFFFF,0,'',inline='col')


// -------- Bearish trend (blue) color selection --------
getBuyColor(count) =>
    if count == 1
        color.new(#11e7f2,0)
    else
        if count == 2
            color.new(#11d9f2,0)
        else
            if count == 3
                color.new(#11cbf2,0)
            else
                if count == 4
                    color.new(#11aff2,0)
                else
                    if count == 5
                        color.new(#1193f2,0)
                    else
                        if count == 6
                            color.new(#1176f2,0)
                        else
                            if count == 7
                                color.new(#105df4,0)
                            else
                                if count == 8
                                    color.new(#1051f5,0)
                                else
                                    if count == 9
                                        color.new(#0f44f5,0)
                                    else
                                        if count == 10
                                            color.new(#0c3de0,0)
                                        else
                                            if count == 11
                                                color.new(#0935ca,0)
                                            else
                                                if count == 12
                                                    color.new(#062eb4,0)
                                                else
                                                    if count == 13
                                                        color.new(#02269e,0)

// -------- Bullish trend (blue) color selection --------
getSellColor(count) =>
    if count == 1
        color.new(#eef211,0)
    else
        if count == 2
            color.new(#efdc11,0)
        else
            if count == 3
                color.new(#f0c511,0)
            else
                if count == 4
                    color.new(#f1af11,0)
                else
                    if count == 5
                        color.new(#f29811,0)
                    else
                        if count == 6
                            color.new(#f28811,0)
                        else
                            if count == 7
                                color.new(#f27811,0)
                            else
                                if count == 8
                                    color.new(#f26811,0)
                                else
                                    if count == 9
                                        color.new(#f25811,0)
                                    else
                                        if count == 10
                                            color.new(#ea420d,0)
                                        else
                                            if count == 11
                                                color.new(#e12c09,0)
                                            else
                                                if count == 12
                                                    color.new(#d81605,0)
                                                else
                                                    if count == 13
                                                        color.new(#cf0000,0)

// -------- Calculate bearish trend sequence --------
buySetup = 0
buySetup := close < close[4] ? buySetup[1] == 13 ? 1 : buySetup[1] + 1 : 0


// -------- Calculate bullish trend sequence --------
sellSetup = 0
sellSetup := close > close[4] ? sellSetup[1] == 13 ? 1 : sellSetup[1] + 1 : 0


// -------- Paint bars --------
barColour = buySetup >= 1 ? getBuyColor(buySetup) : sellSetup >= 1 ? getSellColor(sellSetup) : na
//barcolor(paintBars ? barColour : na, title='Bar colors (heatmap)')


if buySetup == 13
    strategy.entry("Enter Long", strategy.long)
else if sellSetup == 13
    strategy.entry("Enter Short", strategy.short)
- Tren linier
- Pola Waktu Fibonacci
- Tren Pivot
- Super trend B
- KijunSen Line dengan Cross
- Tren Berlian
- Momentum 2.0
- Tren Heikin-Ashi
- Titik Pembalikan Demark
- Sebuah garis lurus Tren Demo
- RSI MTF Ob+Os
- Strategi MACD Willy
- RSI - Sinyal Beli Jual
- Tren Heikin-Ashi
- HA Kebiasan Pasar
- Ichimoku Cloud Smooth Oscillator
- Williams %R - Dihaluskan
- QQE MOD + SSL Hibrida + Ledakan Waddah Attar
- Membeli/Menjual Strat
- Triple Supertrend dengan EMA dan ADX
- jma + dwma oleh multigrain
- MAGIC MACD
- Z Skor dengan Sinyal
- Kebijakan volatilitas yang sederhana dari Shinto dalam bahasa Pine
- 3EMA + Boullinger + PIVOT
- baguette dengan multigrain
- MillMachine
- Indikator pembalikan K I
- Lilin yang Menelan
- MA Kaisar Insiliconot