Titik Pivot Supertrend
Penulis:ChaoZhang, Tanggal: 2022-05-17 15:45:37Tag:PivotATR
Halo semua,
Ada banyak jenis SuperTrend di sekitar. baru-baru ini saya berpikir tentang Supertrend berdasarkan Pivot Points kemudian saya menulis
Gagasan di balik skrip ini adalah menemukan titik pivot, menghitung rata-rata dari mereka dan seperti dalam supertrend menciptakan band yang lebih tinggi / lebih rendah oleh ATR. Seperti yang Anda lihat dalam algoritma skrip memberikan bobot ke titik pivot masa lalu, ini dilakukan untuk meluruskannya sedikit.
backtest
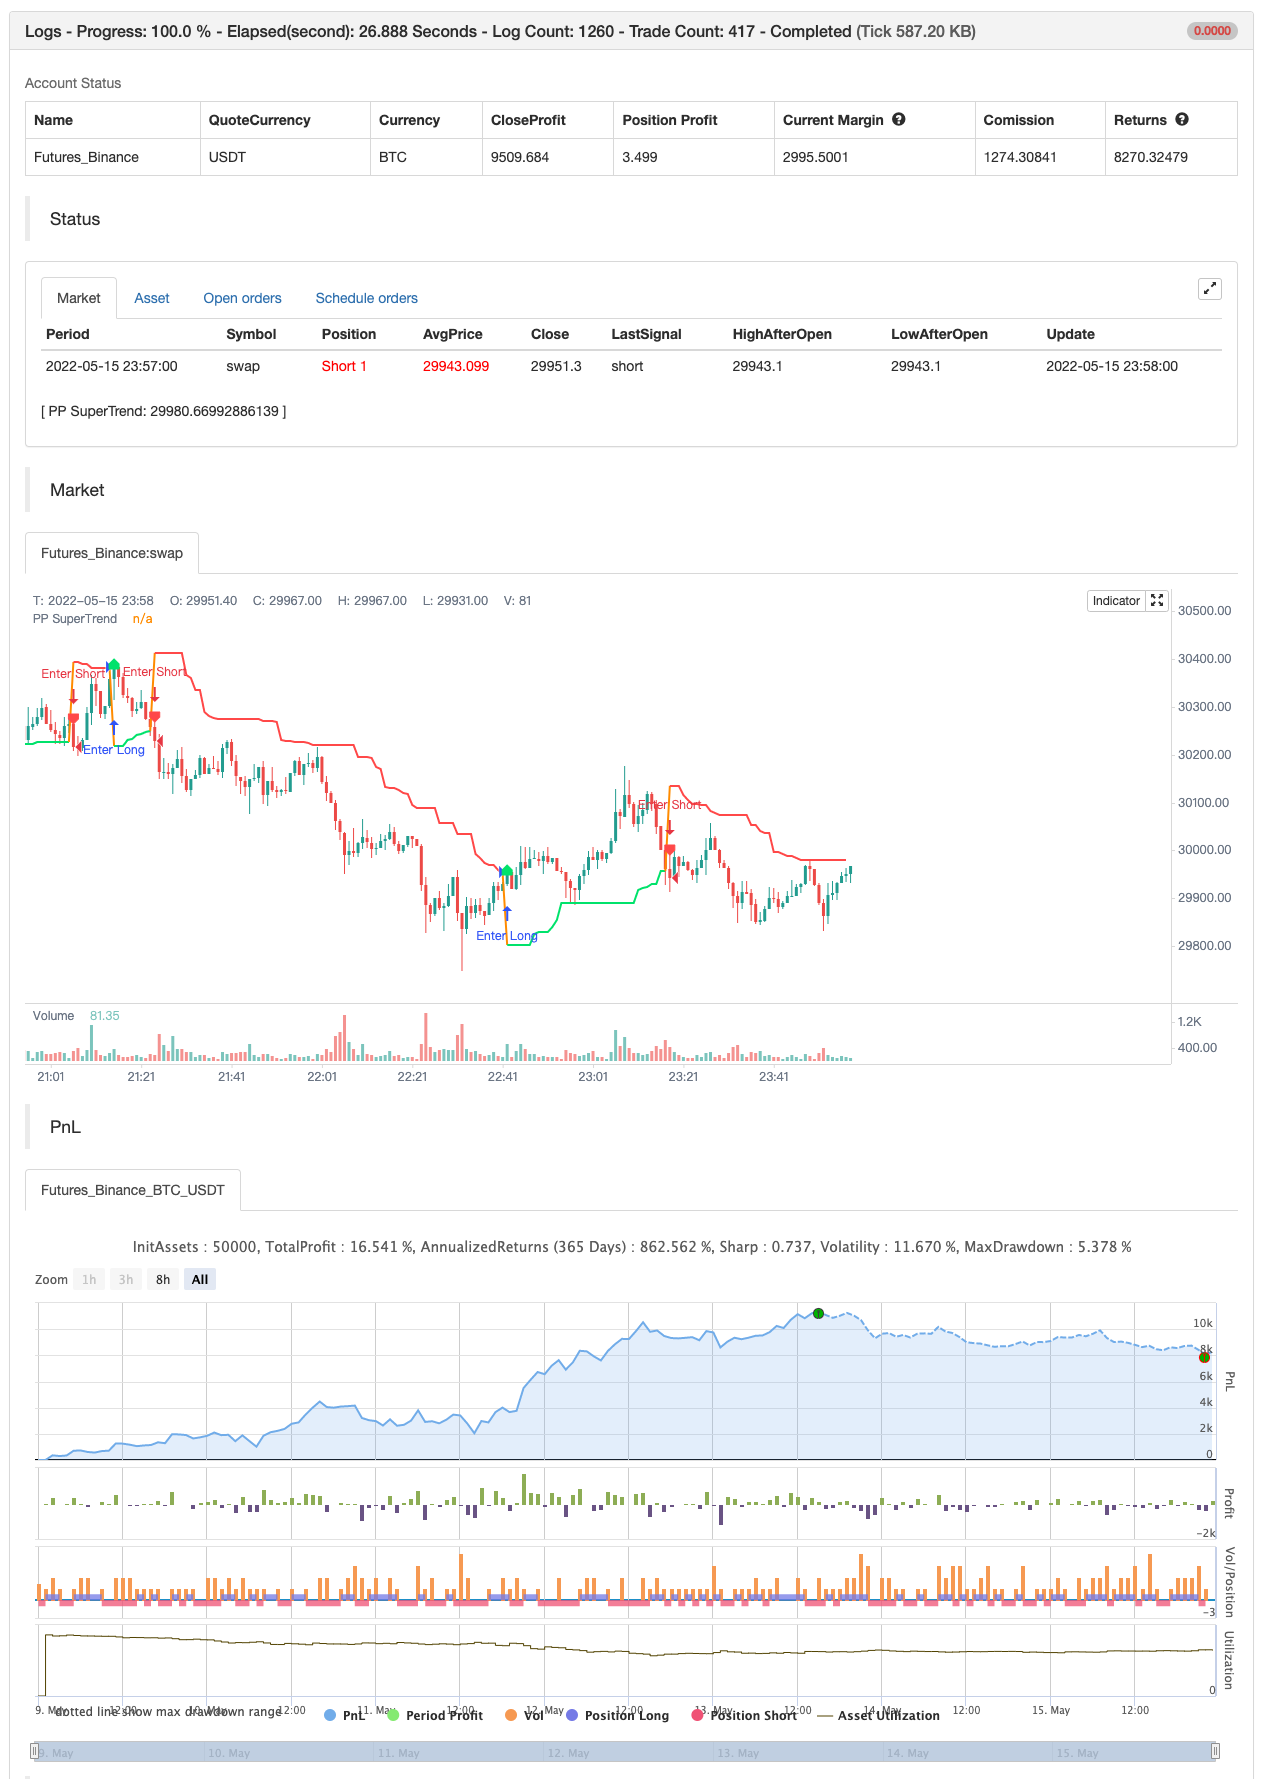
/*backtest
start: 2022-05-09 00:00:00
end: 2022-05-15 23:59:00
period: 1m
basePeriod: 1m
exchanges: [{"eid":"Futures_Binance","currency":"BTC_USDT"}]
*/

// This source code is subject to the terms of the Mozilla Public License 2.0 at https://mozilla.org/MPL/2.0/
// © LonesomeTheBlue

//@version=4
study("Pivot Point SuperTrend", overlay = true)
prd = input(defval = 3, title="Pivot Point Period", minval = 1, maxval = 50)
Factor=input(defval = 2, title = "ATR Factor", minval = 1, step = 0.1)
Pd=input(defval = 6, title = "ATR Period", minval=1)
showpivot = input(defval = false, title="Show Pivot Points")
showlabel = input(defval = true, title="Show Buy/Sell Labels")
showcl = input(defval = false, title="Show PP Center Line")
showsr = input(defval = false, title="Show Support/Resistance")

// get Pivot High/Low
float ph = pivothigh(prd, prd)
float pl = pivotlow(prd, prd)

// drawl Pivot Points if "showpivot" is enabled
plotshape(ph and showpivot, text="H",  style=shape.labeldown, color=na, textcolor=color.red, location=location.abovebar, transp=0, offset = -prd)
plotshape(pl and showpivot, text="L",  style=shape.labeldown, color=na, textcolor=color.lime, location=location.belowbar, transp=0, offset = -prd)

// calculate the Center line using pivot points
var float center = na
float lastpp = ph ? ph : pl ? pl : na
if lastpp
    if na(center)
        center := lastpp
    else
        //weighted calculation
        center := (center * 2 + lastpp) / 3

// upper/lower bands calculation
Up = center - (Factor * atr(Pd))
Dn = center + (Factor * atr(Pd))

// get the trend
float TUp = na
float TDown = na
Trend = 0
TUp := close[1] > TUp[1] ? max(Up, TUp[1]) : Up
TDown := close[1] < TDown[1] ? min(Dn, TDown[1]) : Dn
Trend := close > TDown[1] ? 1: close < TUp[1]? -1: nz(Trend[1], 1)
Trailingsl = Trend == 1 ? TUp : TDown

// plot the trend
linecolor = Trend == 1 and nz(Trend[1]) == 1 ? color.lime : Trend == -1 and nz(Trend[1]) == -1 ? color.red : na
plot(Trailingsl, color = linecolor ,  linewidth = 2, title = "PP SuperTrend")

plot(showcl ? center : na, color = showcl ? center < hl2 ? color.blue : color.red : na)

// check and plot the signals
bsignal = Trend == 1 and Trend[1] == -1
ssignal = Trend == -1 and Trend[1] == 1
plotshape(bsignal and showlabel ? Trailingsl : na, title="Buy", text="Buy", location = location.absolute, style = shape.labelup, size = size.tiny, color = color.lime, textcolor = color.black, transp = 0)
plotshape(ssignal and showlabel ? Trailingsl : na, title="Sell", text="Sell", location = location.absolute, style = shape.labeldown, size = size.tiny, color = color.red, textcolor = color.white, transp = 0)

//get S/R levels using Pivot Points
float resistance = na
float support = na
support := pl ? pl : support[1]
resistance := ph ? ph : resistance[1]

// if enabled then show S/R levels
plot(showsr and support ? support : na, color = showsr and support ? color.lime : na, style = plot.style_circles, offset = -prd)
plot(showsr and resistance ? resistance : na, color = showsr and resistance ? color.red : na, style = plot.style_circles, offset = -prd)

// alerts
alertcondition(Trend == 1 and Trend[1] == -1, title='Buy Signal', message='Buy Signal')
alertcondition(Trend == -1 and Trend[1] == 1, title='Sell Signal', message='Sell Signal')
alertcondition(change(Trend), title='Trend Changed', message='Trend Changed')


if Trend == 1 and Trend[1] == -1
    strategy.entry("Enter Long", strategy.long)
else if Trend == -1 and Trend[1] == 1
    strategy.entry("Enter Short", strategy.short)
Berkaitan
- Villa Dinamic Pivot Supertrend Strategi
- Progressi Fibonacci Dengan Jeda
- baguette dengan multigrain
- SUPERTREND ATR DENGAN TRAILING Hentikan Hilang
- MillMachine
- Landelier Exit
- AlphaTrend menggunakan MFI
- Blok Perintah Pivot
- Titik Pivot Tinggi Rendah Multi Time Frame
- Pivot Berbasis Trailing Maxima & Minima
Lebih banyak
- Rasio energi arah berakselerasi volume RedK
- Donchian Breakout tidak ada cat ulang
- RedK Momentum Bars
- SuperJump Turn Back Bollinger Band
- Tren Fukuiz
- BOT Johny
- SSL hibrida
- Landelier Exit
- RISOTTO
- EMA Cloud Intraday Strategi
- Supertrend+4 bergerak
- ZigZag berdasarkan momentum
- VuManChu Cipher B + Divergences Strategi
- Konsep Dual SuperTrend
- Super Scalper
- Pengujian balik- Indikator
- Trendycious
- Pembunuh Sma BTC
- Cithakan Alerts ML
- Progressi Fibonacci Dengan Jeda