Tren Fukuiz
Penulis:ChaoZhang, Tanggal: 2022-05-18 10:25:47Tag:RMARSI
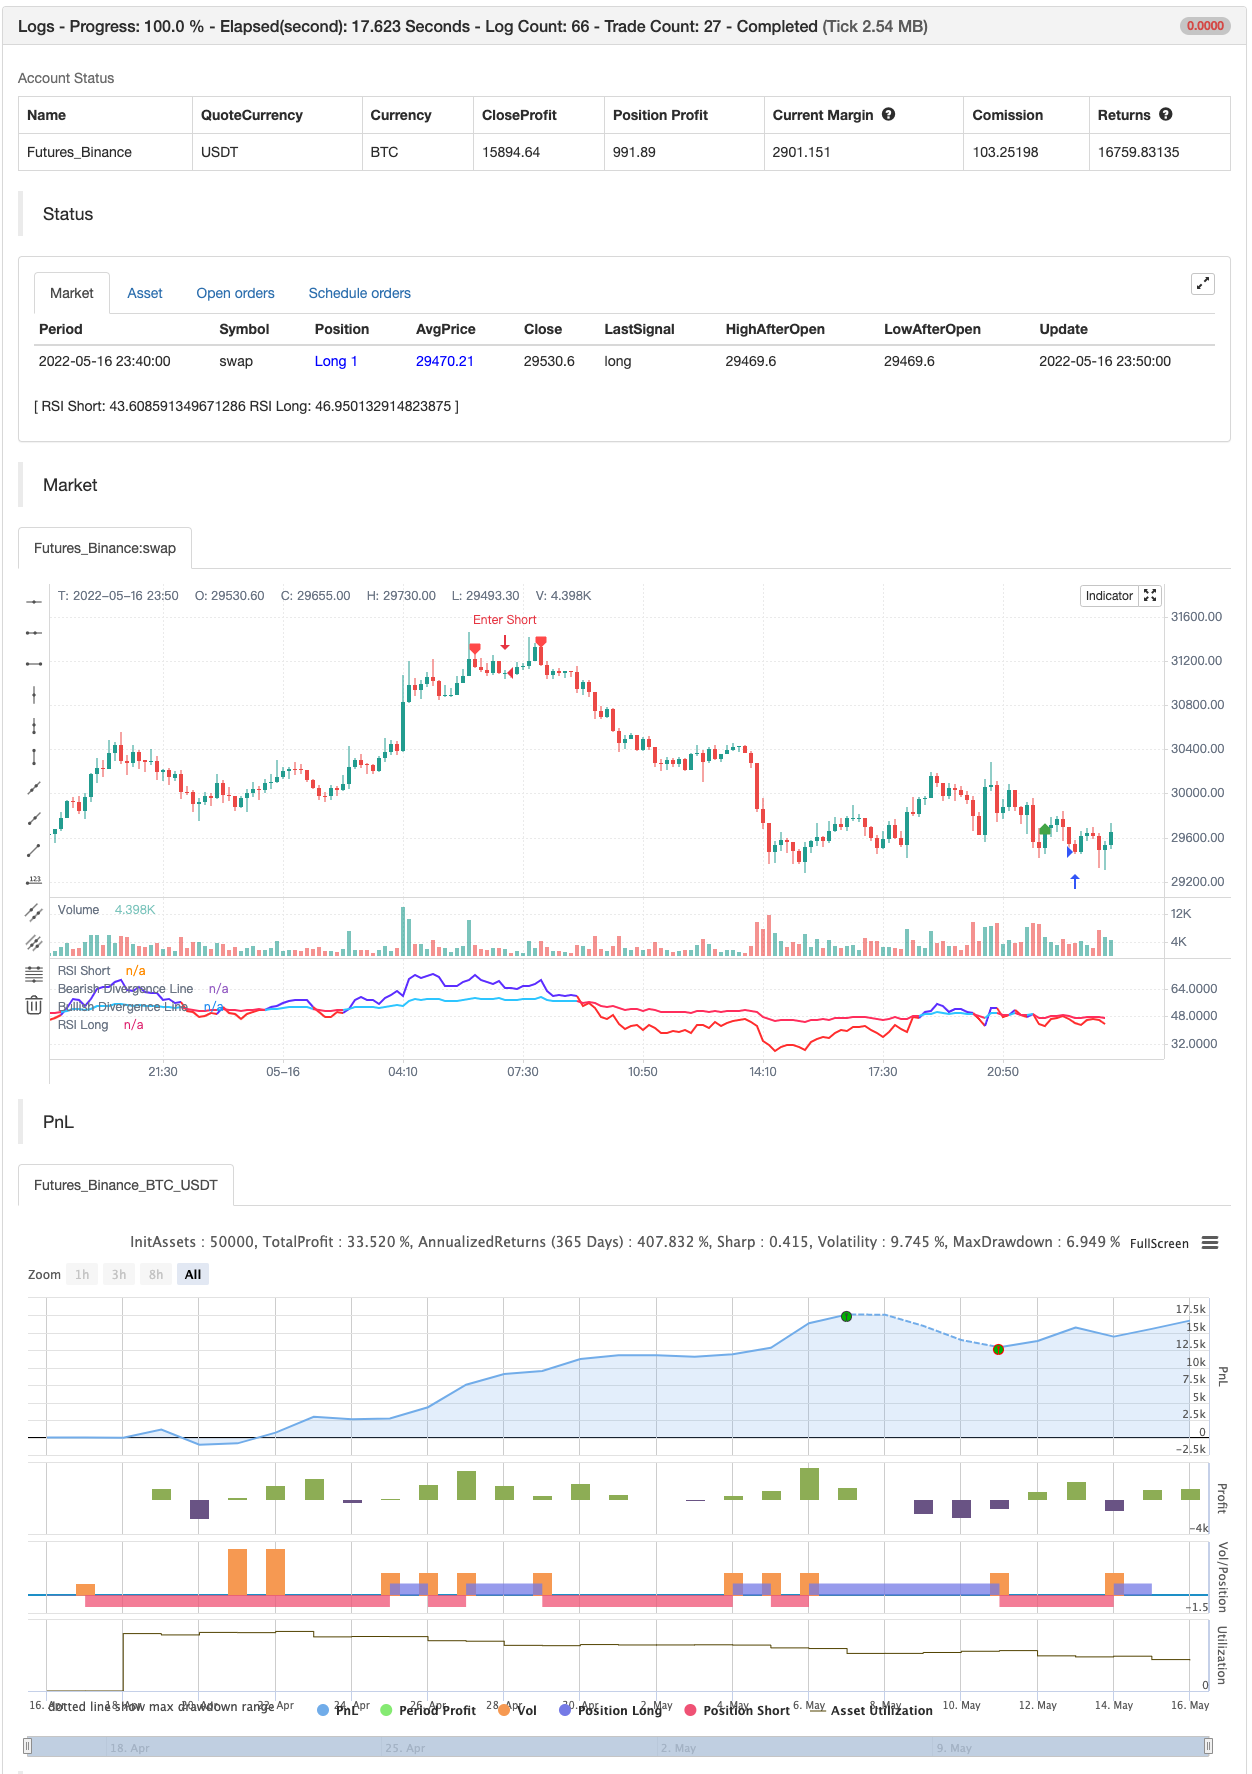
Indikator ini didasarkan pada RSI dari 2 periode yang berbeda.
# Pengantar singkat untuk RSI # Indeks kekuatan relatif (RSI) adalah indikator momentum yang digunakan dalam analisis teknis yang mengukur besarnya perubahan harga baru-baru ini untuk mengevaluasi kondisi overbought atau oversold dalam harga saham atau aset lainnya.
Interpretasi dan penggunaan tradisional dari RSI adalah bahwa nilai 70 atau di atas menunjukkan bahwa sekuritas menjadi overbought atau overvalued dan dapat dipersiapkan untuk pembalikan tren atau penarikan korektif dalam harga.
# Dalam indikator ini # Aku melihat bahwa Anda dapat menggunakan 2 RSI dengan periode yang berbeda untuk menunjukkan tren Bullish dan tren Bearish.
# Kondisi antara RSI pendek dan panjang melintasi # Crossover = Trend bullish (zona biru) Crossunder = Trend bearish (zona merah)
backtesting
/*backtest
start: 2022-04-17 00:00:00
end: 2022-05-16 23:59:00
period: 10m
basePeriod: 1m
exchanges: [{"eid":"Futures_Binance","currency":"BTC_USDT"}]
*/

//@version=5
//Fukuiz
indicator(title='Fukuiz Trend', shorttitle='Fukuiz Trend', format=format.price, precision=2, timeframe='')

//color//
colorwhite = #FFFFFF
colorblue = #6633FF
colorred = #FF3333
colorblue2 = #33CCFF
colorpink = #FF3366

//Fuction//
len = input.int(24, minval=1, title='RSI Short')
len2 = input.int(100, minval=1, title='RSI Long')
src = input(open, 'Source')
up = ta.rma(math.max(ta.change(src), 0), len)
down = ta.rma(-math.min(ta.change(src), 0), len)
up2 = ta.rma(math.max(ta.change(src), 0), len2)
down2 = ta.rma(-math.min(ta.change(src), 0), len2)
rsi = down == 0 ? 100 : up == 0 ? 0 : 100 - 100 / (1 + up / down)
rsi2 = down2 == 0 ? 100 : up2 == 0 ? 0 : 100 - 100 / (1 + up2 / down2)

Bullish = rsi > rsi2
Bearish = rsi < rsi2
Fukuizcolor = Bullish ? color.new(colorblue,0) : Bearish ? color.new(colorred,0) : na
Fukuizcolor2 = Bullish ? color.new(colorblue2,0) : Bearish ? color.new(colorpink,0) : na
Fukuizcolor3 = Bullish ? color.new(colorblue,75) : Bearish ? color.new(colorred,75) : na

//Plot//
l1 = plot(rsi, 'RSI Short', color=Fukuizcolor, linewidth=2, style=plot.style_line)
l2 = plot(rsi2, 'RSI Long', color=Fukuizcolor2, linewidth=2, style=plot.style_line)
band2 = hline(50, 'Middle Band', color=#FFCC99)
band1 = hline(70, 'Upper Band', color=#FFCC99)
band0 = hline(30, 'Lower Band', color=#FFCC99)
fill(band1, band0, color.new(#0946CA, 90), title='Background')
fill(l1, l2, color=Fukuizcolor3, title='Trend Background')


//DIVERGENCE//
lbR = input(title='Pivot Lookback Right', defval=5)
lbL = input(title='Pivot Lookback Left', defval=5)
rangeUpper = input(title='Max of Lookback Range', defval=60)
rangeLower = input(title='Min of Lookback Range', defval=5)
plotBull = input(title='Bullish Divergence', defval=true)
plotBear = input(title='Bearish Divergence', defval=true)
bearColor = color.red
bullColor = color.green
hiddenBullColor = color.new(color.green, 80)
hiddenBearColor = color.new(color.red, 80)
textColor = color.white
noneColor = color.new(color.white, 100)
osc = ta.rsi(src, len)

plFound = na(ta.pivotlow(osc, lbL, lbR)) ? false : true
phFound = na(ta.pivothigh(osc, lbL, lbR)) ? false : true
_inRange(cond) =>
    bars = ta.barssince(cond == true)
    rangeLower <= bars and bars <= rangeUpper

oscHL = osc[lbR] > ta.valuewhen(plFound, osc[lbR], 1) and _inRange(plFound[1])
priceLL = low[lbR] < ta.valuewhen(plFound, low[lbR], 1)
bullCond = plotBull and priceLL and oscHL and plFound

plot(plFound ? osc[lbR] : na, offset=-lbR, title='Bullish Divergence Line', linewidth=2, color=bullCond ? bullColor : noneColor,display=display.none)

plotshape(bullCond ? osc[lbR] : na, offset=-lbR, title='Bullish Divergence Label', text=' Bull ', style=shape.labelup, location=location.absolute, color=color.new(bullColor, 0), textcolor=color.new(textColor, 0))

oscLH = osc[lbR] < ta.valuewhen(phFound, osc[lbR], 1) and _inRange(phFound[1])
priceHH = high[lbR] > ta.valuewhen(phFound, high[lbR], 1)
bearCond = plotBear and priceHH and oscLH and phFound

plot(phFound ? osc[lbR] : na, offset=-lbR, title='Bearish Divergence Line', linewidth=2, color=bearCond ? bearColor : noneColor,display=display.none)

plotshape(bearCond ? osc[lbR] : na, offset=-lbR, title='Bearish Divergence Label', text=' Bear ', style=shape.labeldown, location=location.absolute, color=color.new(bearColor, 0), textcolor=color.new(textColor, 0))


if bullCond
    strategy.entry("Enter Long", strategy.long)
else if bearCond
    strategy.entry("Enter Short", strategy.short)
- Super Scalper - 5 menit 15 menit
- Scalping EMA ADX RSI dengan Buy/Sell
- RSI - Sinyal Beli Jual
- Strategi RSI
- Strategi Indeks Kekuatan Relatif RSI
- RSI oleh zdmre
- RSI MTF Ob+Os
- TMA-Legacy
- SuperTREX
- Bollinger + RSI, Strategi Ganda v1.1
- CM MACD Custom Indicator - Multiple Time Frame - V2
- HODL LINE
- 2 Deteksi Arah Rata-rata Bergerak
- Scalping PullBack Tool R1
- Strategi Beli&Jual tergantung pada AO+Stoch+RSI+ATR
- EMA TREND CLOUD
- Rasio energi arah berakselerasi volume RedK
- Donchian Breakout tidak ada cat ulang
- RedK Momentum Bars
- SuperJump Turn Back Bollinger Band
- BOT Johny
- SSL hibrida
- Landelier Exit
- RISOTTO
- EMA Cloud Intraday Strategi
- Titik Pivot Supertrend
- Supertrend+4 bergerak
- ZigZag berdasarkan momentum
- VuManChu Cipher B + Divergences Strategi
- Konsep Dual SuperTrend