BEST Engulfing + Breakout Strategi
Penulis:ChaoZhang, Tanggal: 2022-05-25 14:40:18Tag:RMAEMAWMA
Halo pedagang
Ini adalah algoritma sederhana untuk strategi Tradingview melacak konvergensi dari 2 indikator yang tidak terkait.
Konvergensi adalah solusi untuk masalah perdagangan saya. Ini adalah teka-teki dengan kemungkinan tak terbatas dan hanya beberapa kombinasi yang bekerja.
Ini yang aku suka.
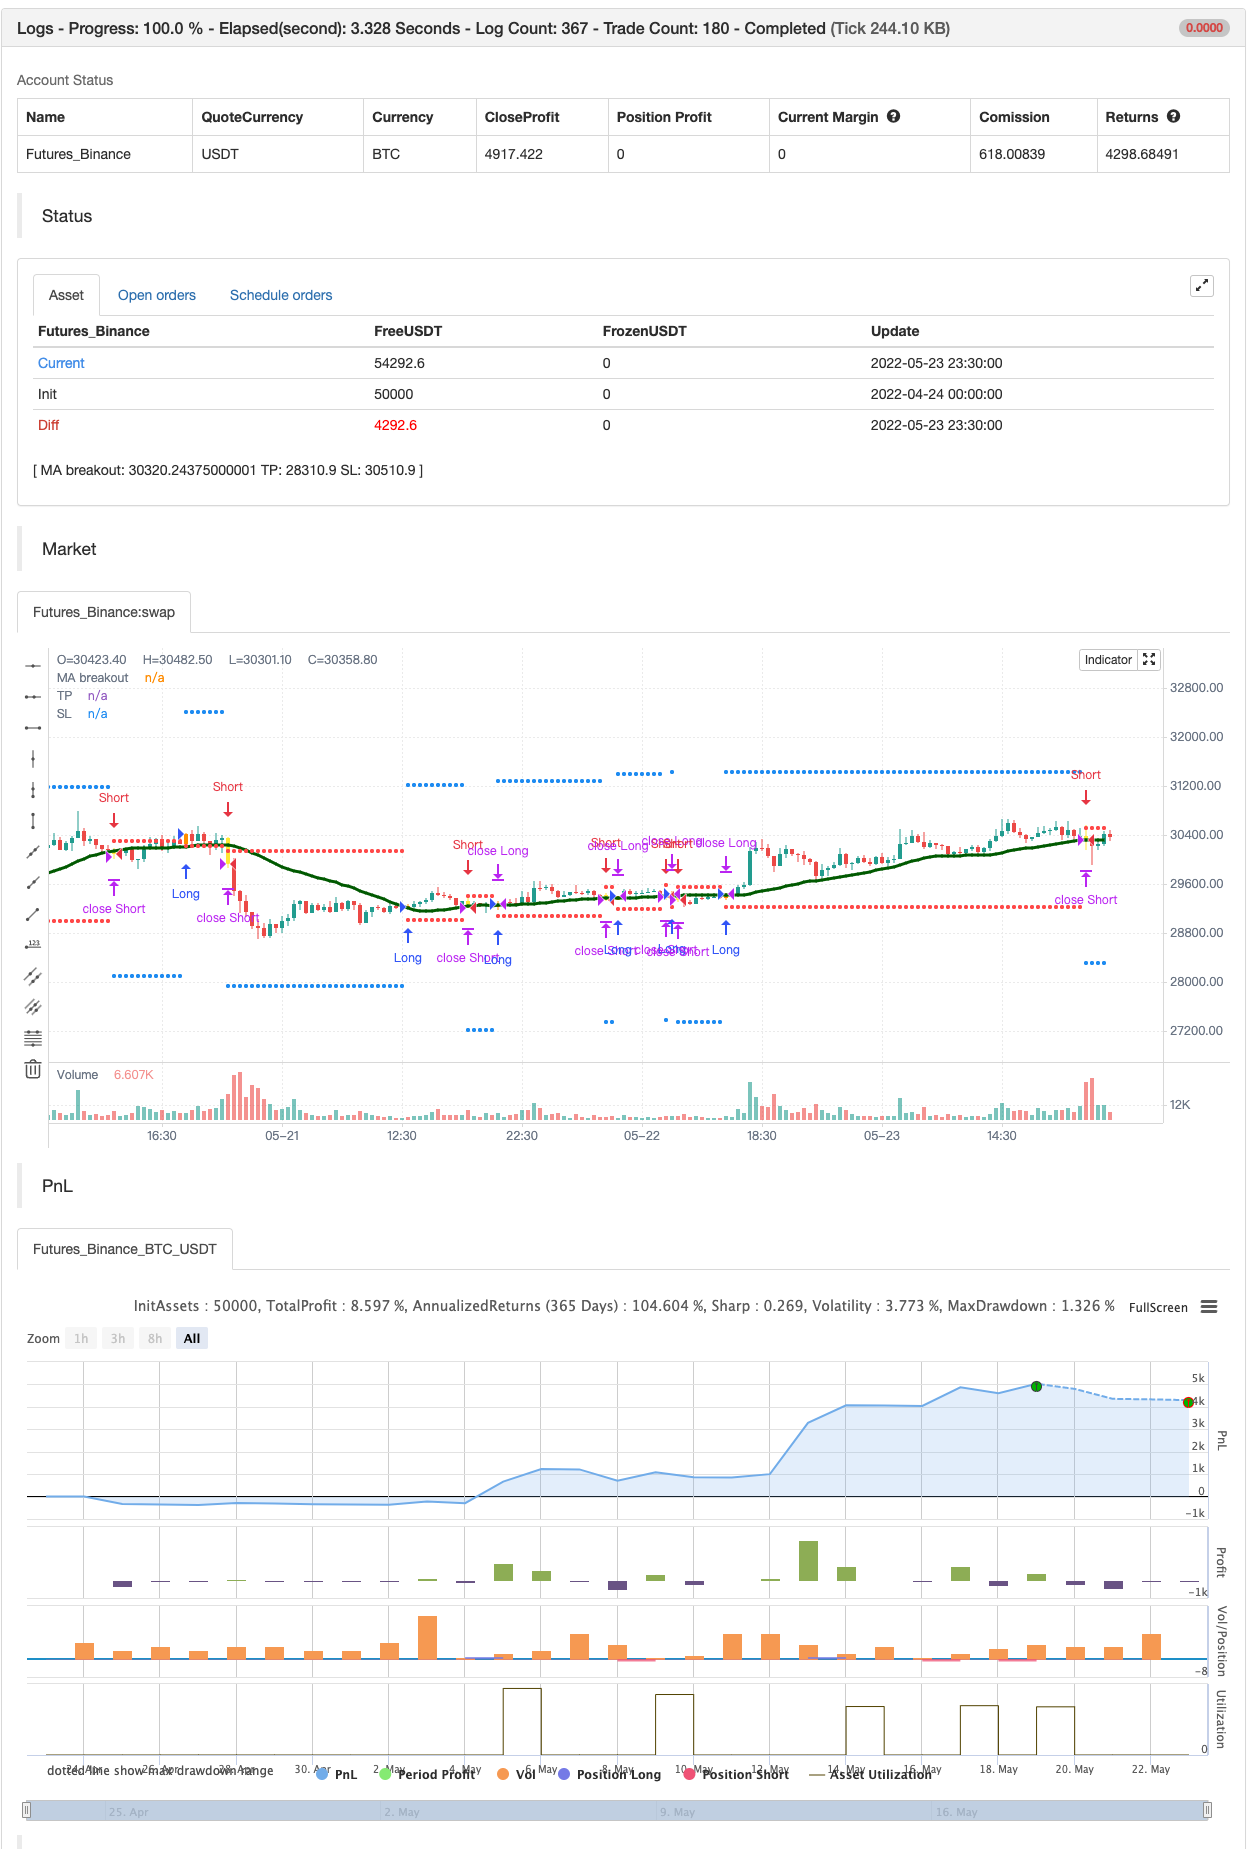
- Pola menelan
- Harga vs moving average untuk mendeteksi breakout
Definisi
Ambil buku catatan :) dan kopi (bagus untuk fokus).
Pola menelan adalah pola pembalikan dua lilin. Lilin kedua benar-benar menelan tubuh asli yang pertama, tanpa memperhatikan panjang bayangan ekor.
Pola bullish Engulfing muncul dalam tren penurunan dan merupakan kombinasi satu lilin merah diikuti oleh lilin hijau yang lebih besar Pola Engulfing bearish muncul dalam tren penurunan dan merupakan kombinasi satu lilin hijau diikuti oleh lilin merah yang lebih besar
Contoh:https://imgur.com/a/krDDUz4
Kami bosan Pak... apa gunanya semua ini?
Singkatnya, engulfing adalah pola untuk melacak pembalikan. (seluruh penonton TradingView berdiri sekarang memberikan tepuk tangan) Menambahkan filter Harga vs Moving rata-rata memungkinkan untuk melacak pembalikan dengan momentum (setengah dari penonton runtuh karena ini terlalu mengagumkan)
Oke pak... Anda mengambil minat saya
Aku menyertakan beberapa filter backtest keren:
- penyaringan rentang tanggal
- Fleksibel mengambil keuntungan dalam nilai USD (digambarkan dalam warna biru)
- Stop loss fleksibel dalam nilai USD (diperlihatkan dengan warna merah)
Semua yang terbaik Dave.
backtest
/*backtest
start: 2022-04-24 00:00:00
end: 2022-05-23 23:59:00
period: 30m
basePeriod: 15m
exchanges: [{"eid":"Futures_Binance","currency":"BTC_USDT"}]
*/

//@version=4
//@author=Daveatt

StrategyName = "BEST Engulfing + MA"
ShortStrategyName = "BEST Engulfing + MA"

strategy(title=StrategyName, shorttitle=ShortStrategyName, overlay=true,
 pyramiding=2, default_qty_value=500, precision=7, currency=currency.USD,
 commission_value=0.2,commission_type=strategy.commission.percent, initial_capital=10000)

includeEngulfing = true

includeMA = true
source_ma = input(title="Source Price vs MA", type=input.source, defval=close)
typeofMA = input(title="Type of MA", defval="SMA", options=["RMA", "SMA", "EMA", "WMA", "VWMA", "SMMA", "KMA", "TMA", "HullMA", "DEMA", "TEMA"])
length_ma = input(32, title = "MA Length", type=input.integer)

// ---------- Candle components and states
GreenCandle = close > open
RedCandle = close < open
NoBody = close==open
Body = abs(close-open)


// bullish conditions
isBullishEngulfing1 = max(close[1],open[1]) < max(close,open) and min(close[1],open[1]) > min(close,open) and Body > Body[1] and GreenCandle and RedCandle[1]
isBullishEngulfing2 = max(close[1],open[1]) < max(close,open) and min(close[1],open[1]) <= min(close,open) and Body > Body[1] and GreenCandle and RedCandle[1]

// bearish conditions
isBearishEngulfing1 = max(close[1],open[1]) < max(close,open) and min(close[1],open[1]) > min(close,open) and Body > Body[1] and RedCandle and GreenCandle[1]
isBearishEngulfing2 = max(close[1],open[1]) >= max(close,open) and min(close[1],open[1]) > min(close,open) and Body > Body[1] and RedCandle and GreenCandle[1]

// consolidation of conditions
isBullishEngulfing = isBullishEngulfing1 or isBullishEngulfing2
isBearishEngulfing = isBearishEngulfing1 or isBearishEngulfing2

//isBullishEngulfing = max(close[1],open[1]) < max(close,open) and min(close[1],open[1]) > min(close,open) and Body > Body[1] and GreenCandle and RedCandle[1]
//isBearishEngulfing = max(close[1],open[1]) < max(close,open) and min(close[1],open[1]) > min(close,open) and Body > Body[1] and RedCandle and GreenCandle[1]

Engulf_curr = 0 - barssince(isBearishEngulfing) + barssince(isBullishEngulfing)
Engulf_Buy = Engulf_curr < 0 ? 1 : 0
Engulf_Sell = Engulf_curr > 0 ? 1 : 0


// Price vs MM


smma(src, len) =>
    smma = 0.0
    smma := na(smma[1]) ? sma(src, len) : (smma[1] * (len - 1) + src) / len
    smma

ma(smoothing, src, length) =>
    if smoothing == "RMA"
        rma(src, length)
    else
        if smoothing == "SMA"
            sma(src, length)
        else
            if smoothing == "EMA"
                ema(src, length)
            else
                if smoothing == "WMA"
                    wma(src, length)
				else
					if smoothing == "VWMA"
						vwma(src, length)
					else
						if smoothing == "SMMA"
						    smma(src, length)
						else
							if smoothing == "HullMA"
								wma(2 * wma(src, length / 2) - wma(src, length), round(sqrt(length)))
							else
								if smoothing == "LSMA"
									src
								else
								    if smoothing == "KMA"
								        xPrice = src
                                        xvnoise = abs(xPrice - xPrice[1])
                                        nfastend = 0.666
                                        nslowend = 0.0645
                                        nsignal = abs(xPrice - xPrice[length])
                                        nnoise = sum(xvnoise, length)
                                        nefratio = iff(nnoise != 0, nsignal / nnoise, 0)
                                        nsmooth = pow(nefratio * (nfastend - nslowend) + nslowend, 2)
                                        nAMA = 0.0
                                        nAMA := nz(nAMA[1]) + nsmooth * (xPrice - nz(nAMA[1]))
                                        nAMA
								    else
								        if smoothing == "TMA"
									        sma(sma(close, length), length)
						                else
							                if smoothing == "DEMA"
							                    2 * src - ema(src, length)
							                else
							                    if smoothing == "TEMA"
							                        3 * (src - ema(src, length)) + ema(ema(src, length), length)
							                    else
		    							            src


MA = ma(typeofMA, source_ma, length_ma)

plot(MA, color=#006400FF, title="MA breakout", linewidth=3)

macrossover  = crossover (source_ma, MA)
macrossunder = crossunder(source_ma, MA)

since_ma_buy = barssince(macrossover)
since_ma_sell = barssince(macrossunder)
macross_curr = 0 - since_ma_sell + since_ma_buy
bullish_MA_cond = macross_curr < 0 ?  1 : 0
bearish_MA_cond = macross_curr > 0 ? 1  : 0

posUp = (Engulf_Buy ? 1 : 0) + (bullish_MA_cond ? 1 : 0)
posDn = (Engulf_Sell ? 1 : 0) + (bearish_MA_cond ? 1 : 0)

conditionUP = posUp == 2 and posUp[1] < 2
conditionDN = posDn == 2 and posDn[1] < 2


sinceUP = barssince(conditionUP)
sinceDN = barssince(conditionDN)

// primary-first signal of the trend
nUP = crossunder(sinceUP,sinceDN)
nDN = crossover(sinceUP,sinceDN)


// and the following secondary signals

// save of the primary signal
sinceNUP = barssince(nUP)
sinceNDN = barssince(nDN)

buy_trend   = sinceNDN > sinceNUP
sell_trend  = sinceNDN < sinceNUP

// engulfing by
barcolor(nUP ? color.orange : na, title="Bullish condition")
barcolor(nDN ? color.yellow : na, title="Bearish condition")

isLong  = nUP
isShort = nDN

long_entry_price    = valuewhen(nUP, close, 0)
short_entry_price   = valuewhen(nDN, close, 0)

longClose   = close[1] < MA
shortClose  = close[1] > MA

///////////////////////////////////////////////
//* Backtesting Period Selector | Component *//
///////////////////////////////////////////////


StartYear = input(2017, "Backtest Start Year",minval=1980)
StartMonth = input(1, "Backtest Start Month",minval=1,maxval=12)
StartDay = input(1, "Backtest Start Day",minval=1,maxval=31)
testPeriodStart = timestamp(StartYear,StartMonth,StartDay,0,0)

StopYear = input(2020, "Backtest Stop Year",minval=1980)
StopMonth = input(12, "Backtest Stop Month",minval=1,maxval=12)
StopDay = input(31, "Backtest Stop Day",minval=1,maxval=31)
testPeriodStop = timestamp(StopYear,StopMonth,StopDay,0,0)

testPeriod() => true


//////////////////////////
//* Profit Component *//
//////////////////////////

input_tp_pips = input(2000, "Backtest Profit Goal (in USD)",minval=0)
input_sl_pips = input(200, "Backtest STOP Goal (in USD)",minval=0)


tp = buy_trend? long_entry_price + input_tp_pips : short_entry_price - input_tp_pips
sl = buy_trend? long_entry_price - input_sl_pips : short_entry_price + input_sl_pips


long_TP_exit  = buy_trend and high >= tp
short_TP_exit = sell_trend and low <= tp

plot(tp, title="TP", style=plot.style_circles, linewidth=3, color=color.blue)
plot(sl, title="SL", style=plot.style_circles, linewidth=3, color=color.red)

if testPeriod()
    strategy.entry("Long", 1, when=isLong)
    strategy.close("Long", when=longClose )
    strategy.exit("XL","Long", limit=tp,  when=buy_trend, stop=sl)


if testPeriod()
    strategy.entry("Short", 0,  when=isShort)
    strategy.close("Short", when=shortClose )
    strategy.exit("XS","Short", when=sell_trend, limit=tp, stop=sl)
- Rainbow Oscillator
- Super Scalper
- SuperJump Turn Back Bollinger Band
- ESSMA
- MACD yang lebih cerdas
- Super Scalper - 5 menit 15 menit
- Scalping EMA ADX RSI dengan Buy/Sell
- ZigZag berdasarkan momentum
- VWMA-ADX Momentum dan Strategi Bitcoin Long Berbasis Tren
- Williams %R - Dihaluskan
- Pivot Berbasis Trailing Maxima & Minima
- Nick Rypock Mengikuti Reverse (NRTR)
- ZigZag PA Strategi V4.1
- Pembelian/penjualan intraday
- Broken Fractal: Mimpi seseorang yang hancur adalah keuntungan Anda!
- Maximizer Keuntungan PMax
- Strategi Kemenangan yang Sempurna
- Stochastic + RSI, Strategi Ganda
- Strategi Swing Hull/rsi/EMA
- Scalping Swing Trading Tool R1-4
- Bollinger Awesome Alert R1
- Plugin Simultan Berbagai Bursa
- Triangle Leverage (menghasilkan mata uang kecil dengan harga pasar yang berbeda)
- bybit reverse contract dynamic grid (jaring khusus)
- TradingView Alerts untuk MT4 MT5 + variabel dinamis
- Seri Matriks
- Super Scalper - 5 menit 15 menit
- Indeks Kekuatan Relatif - Perbedaan - Libertus
- Regresi linier ++
- RedK Dual VADER dengan Energy Bar