Strategi Indeks Pembalikan Momentum

Ringkasan
Strategi Relative Momentum Index (RMI) adalah strategi perbaikan yang didasarkan pada indeks momentum. Strategi ini menilai apakah pasar berada dalam keadaan overbought atau oversold dengan menghitung dinamika perubahan harga dalam jangka waktu tertentu untuk menangkap peluang berbalik.
Prinsip Strategi
RMI strategi dihitung dengan rumus sebagai berikut:
javascript
xMom = xPrice - xPrice[Length] //计算Length周期内的价格变动
xMU = 如果xMom >= 0:之前xMU减去xMU/Length加上xMom;否则:之前xMU
xMD = 如果xMom <= 0:之前xMD减去xMD/Length加上xMom的绝对值;否则:0
RM = xMU / xMD
RMI = 100 * (RM / (1 + RM))
Strategi ini pertama-tama menghitung perubahan harga selama periode Length xMom. Jika xMom> = 0, berarti harga naik, maka xMU bertambah xMom; jika xMom < 0, berarti harga turun, maka xMD bertambah xMom. Nilai mutlak dari RM adalah rasio xMU dan xMD, yang mewakili kekuatan penurunan.
Ketika RMI lebih tinggi dari nilai terendah SellZone, berarti overbuy, melakukan shorting; ketika RMI lebih rendah dari nilai terendah BuyZone, berarti oversell, melakukan overdoing.
Keunggulan Strategis
- Indeks RMI lebih sensitif dari RSI, dan lebih cepat menangkap peluang untuk membalikkan harga.
- RMI melakukan pengukuran terhadap intensitas penurunan dan tidak akan terpengaruh oleh peristiwa gempa.
- RMI didasarkan pada momentum, yang dapat lebih akurat menilai status overbought dan oversold.
Risiko Strategis
- Seperti strategi reversal lainnya, strategi RMI memiliki risiko untuk di-leverage.
- Parameter RMI perlu dioptimalkan untuk varietas yang berbeda, jika tidak, hasilnya mungkin tidak baik.
- Jika tidak, sinyal palsu akan terlalu banyak.
Risiko dapat dikurangi dengan cara yang tepat untuk melonggarkan titik-titik stop loss, mengoptimalkan kombinasi parameter, dan kombinasi dengan strategi tren.
Optimasi Strategi
Strategi RMI dapat dioptimalkan dalam beberapa hal:
- Optimalkan parameter Length, pilih panjang siklus yang memaksimalkan keuntungan dari strategi tersebut.
- Optimalkan overbought dan oversold threshold untuk mengurangi kemungkinan sinyal palsu.
- Meningkatkan mekanisme penghentian kerugian, mengendalikan kerugian tunggal.
- Kombinasi dengan trend tracking atau strategi linear, meningkatkan tingkat kemenangan.
- Memilih waktu perdagangan yang tepat sesuai dengan karakteristik varietas yang berbeda, meningkatkan stabilitas strategi.
Meringkaskan
Strategi RMI dengan mengukur perubahan dinamika harga, melakukan operasi reversal, dapat secara efektif menangkap kesempatan untuk membalikkan garis pendek. Dibandingkan dengan strategi RSI, strategi RMI lebih sensitif dan tidak terpengaruh oleh guncangan. Namun, strategi ini masih memiliki risiko yang ditargetkan, perlu mengoptimalkan parameter dan bekerja sama dengan strategi tren untuk mendapatkan efek maksimal.
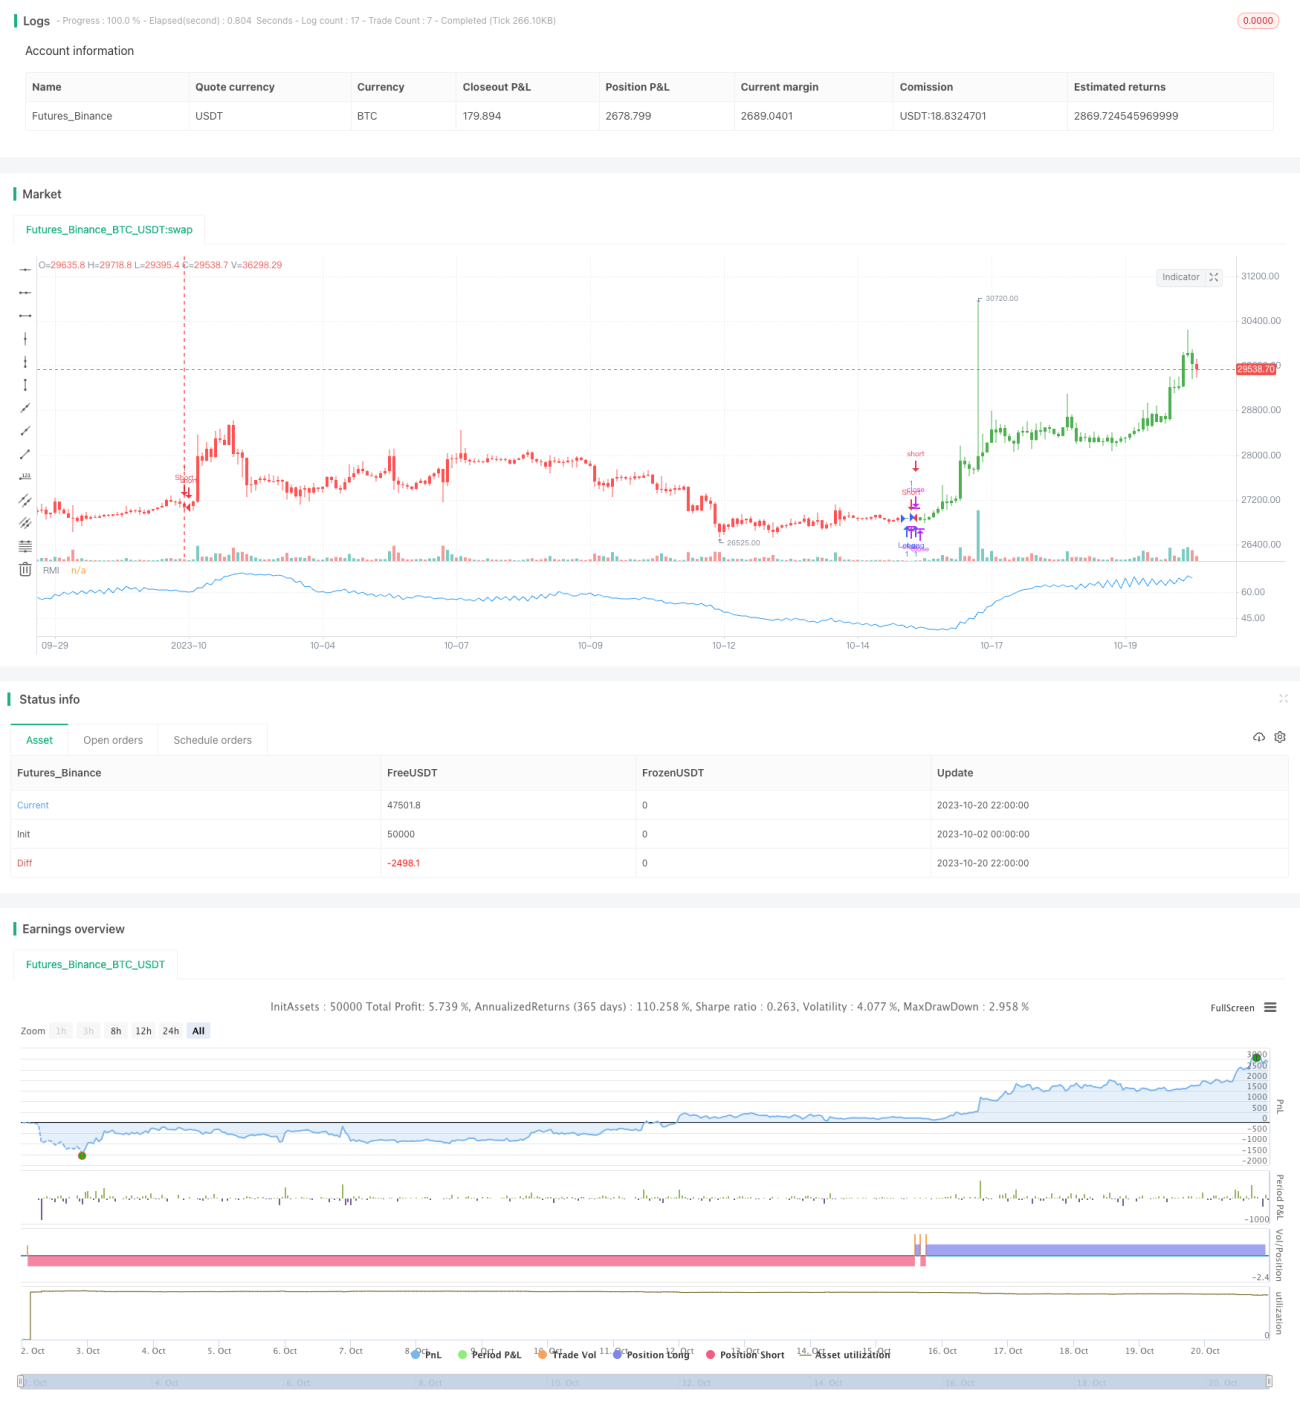
/*backtest
start: 2023-10-02 00:00:00
end: 2023-10-21 00:00:00
period: 2h
basePeriod: 15m
exchanges: [{"eid":"Futures_Binance","currency":"BTC_USDT"}]
*/

//@version=2
////////////////////////////////////////////////////////////
//  Copyright by HPotter v1.0 19/10/2017
// The Relative Momentum Index (RMI) was developed by Roger Altman. Impressed - 1