72s:適応型船体移動平均+
作者: リン・ハーンチャオチャン開催日:2022年5月26日 17:17:37タグ:HMAATR
初心者向けに課題となるのは,市場の条件を区別することであり,現在の市場が利益をできるだけ早く,最短時間で積み上げるのに最適な機会を提供しているか否かです.
HMA 200によって定義されるか,回転するかもしれない.私は,それが起こる開始の明確な兆候を得るために,価格動態 (主要な動きと小さなノイズを分離) により適合するビジュアルを作成することを考えていました.
このアダプティブHMAは,Pine関数に動的長度引数をサポートする新しいPine Scriptの機能を使用しています. (読み:https://www.tradingview.com/blog/en/pine...). 組み込みHMA () を直接サポートしていないが,幸いには,wma () 式を使って構築できる. (注:wmaの長さで丸の代わりに plain int (int)) を使って,すでに人気のあるHMA 式を少し修正した.
アダプティブHMA期間がどの側面に対応するか 選択できます
この研究では2つのオプションで提示します.ボリュームとボラティリティ.それは,その側面が現在どのような状況にあるかに依存して,より速くまたはゆっくりと動きます.すなわち:ボリュームが一般的に低いとき,または波動的な読み上げが存在しないとき,価格はあまり動かないので,適応するMAは,回顧期間を動的に延長することによって減速します.そしてその逆,そしてそうです.
アダプティブの色マークは,上述した状況に似ています.さらに,私はそれをMAの傾斜計算と組み合わせて,トレンド強度や横向き/
視覚的に信頼性が高くなります 視覚的に信頼性が高くなります
2つ目に,そしてもっと重要なことは,取引が価値あるのかどうかについてのよりよい確率情報を持つトレーダーに役立つかもしれません.つまり: 市場が間もなく多くの動きを与えなければ,利益もそれだけになります.ほとんどの場合,我々は後で私たちの10セントを貯めるか,他の場所に置くのが良いかもしれません.
使用方法: よりよい動的サポート/抵抗とより明確な突破確認のほか,MAは以下の色で示されています. 黄色: 市場は統合またはフラットです.横向き,不安定,または比較的小さな動きです.それがトレンド市場に現れる場合,それは現在のトレンドが方向を変えようとしているかもしれない,または別の方向に価格が突破したことを確認する早期の兆候かもしれません. 明るい緑色か 明るい赤色: トレンドが形成されているが,まだ比較的弱い (または弱くなっている) 傾向であるかどうかを教えてくれます.それはサポートするボリュームや波動性がないからです. 濃い緑色か濃い赤色 価格の動きが強くなると,多くの場合,新しい長期的な大きなトレンドの始まりとなります.
設定: 充電器: HMAがどの側面に 接続すべきかを選択し,それに適応します. 最短期間,最長期間: 172 - 233 は,イントラデイで静的なHMA 200を上回るための私の設定です.私は,ほぼすべてのペアで15m tfで,そして一部の株で15mから1Hで,私の取引スタイルで,最も良いと考えています.これは従来のEMA 200とよく機能します.時には,価格がどこへ行くべきかを定義する上で,手並んで働いているように感じます.しかし,もちろん,より広いまたは狭い他の範囲で実験することができます.特に,既に確立した戦略を持っている場合. 統合領域の限界値: 傾き計算と関係があります. 値が大きいほど,市場がフラット (黄色) 領域から外れていることを定義するために,あなたのMAがより大きな程度を必要とします. フィルターを軽くするために必要であれば,これは有用です. 背景の色: 市場状況の違いを強調するための色付けです
警告: 2つの警報がある 音量割れ:音量割れが平均以上になると, 波動度計:市場が大きな揺れるブレスルの瞬間を迎える可能性が高いときです
使用方法: とてもとても良い買い入りをします.
- (価格もMAから遠くないとき,または距離オシレーターも使用して助けることができます)
- HMA
の色は濃い緑色で 充電プラグに表示されています - RSIは50以上です これは追加的な確認として役立ちます.
明らかにSELL入力信号は上記と同じで,ちょうど反対です.
バックテスト
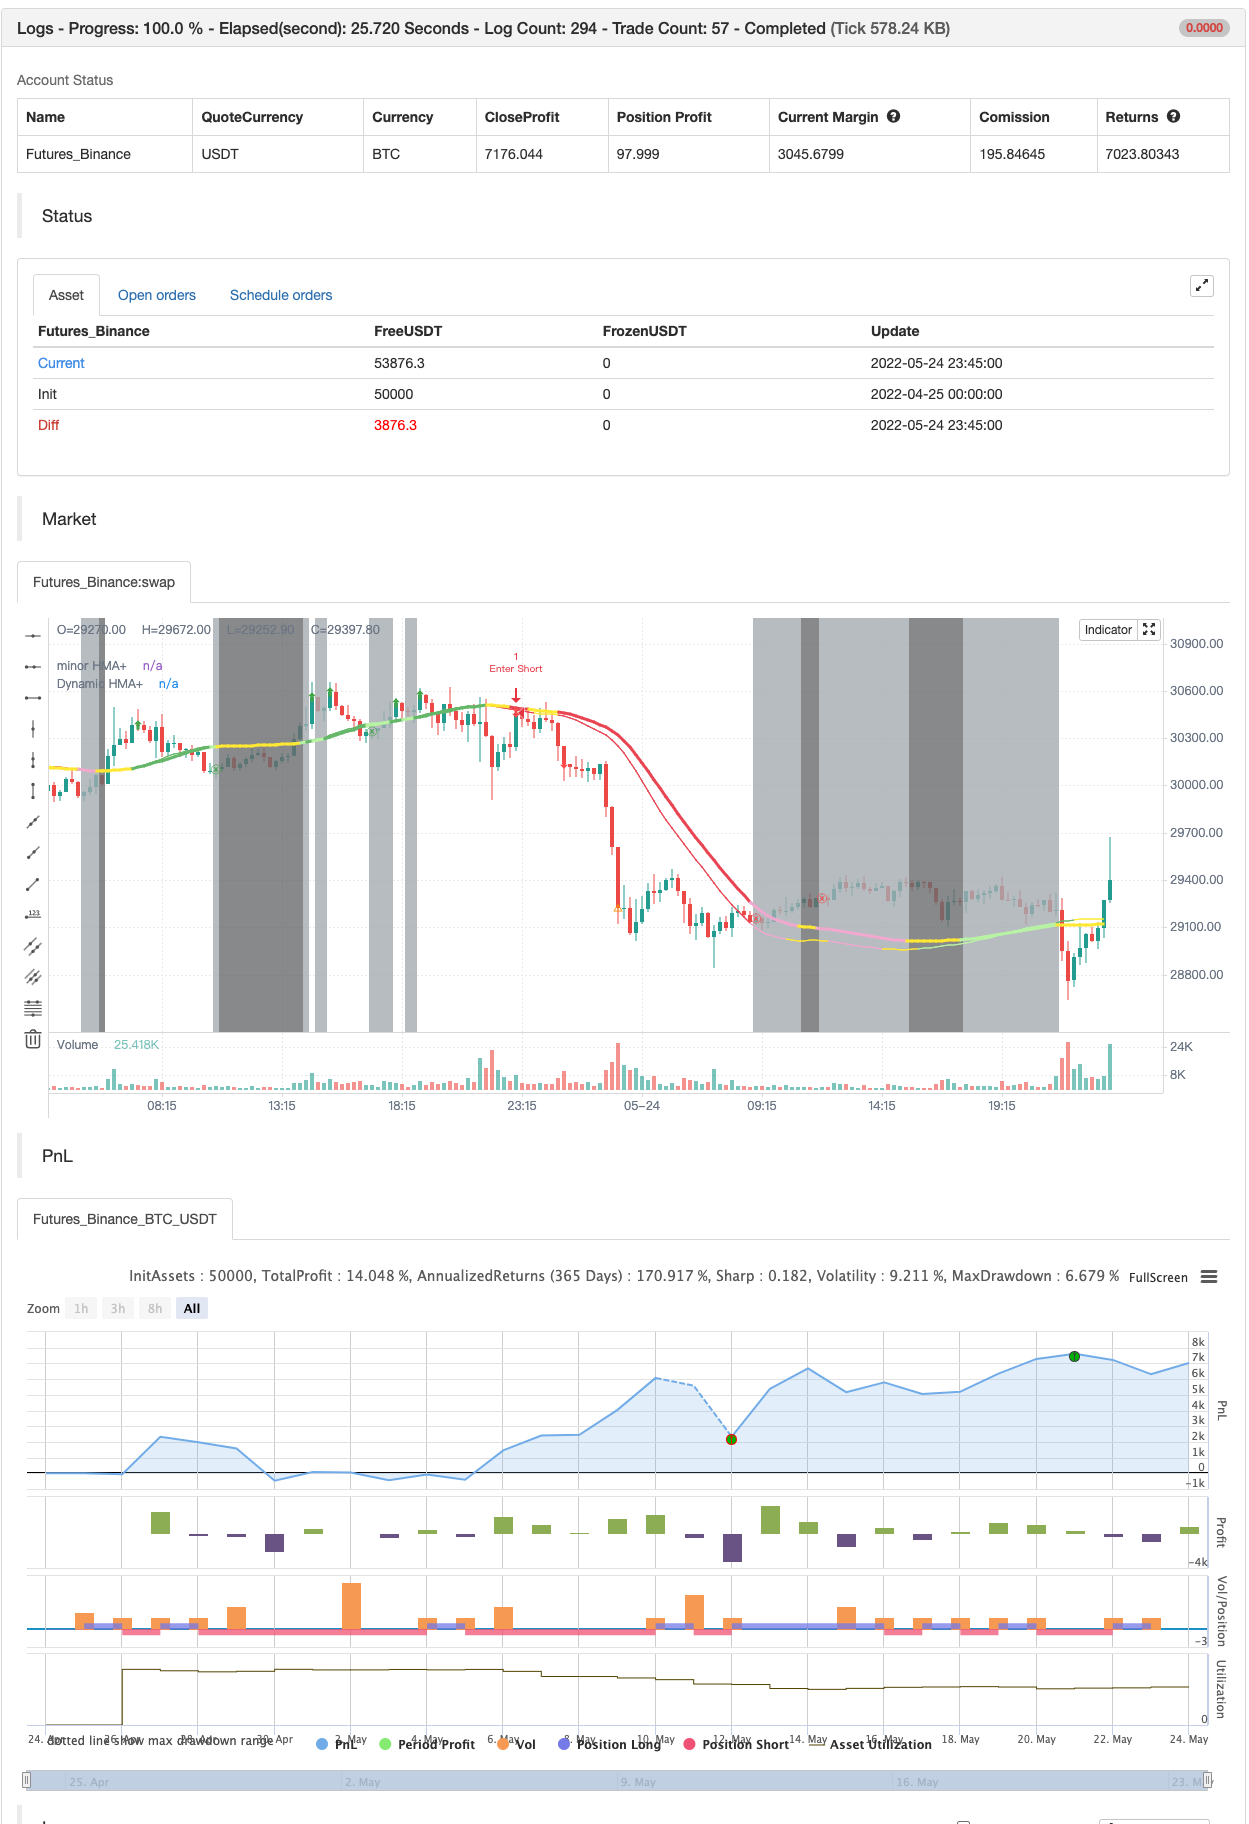
/*backtest
start: 2022-04-25 00:00:00
end: 2022-05-24 23:59:00
period: 15m
basePeriod: 5m
exchanges: [{"eid":"Futures_Binance","currency":"BTC_USDT"}]
*/

// This source code is subject to the terms of the Mozilla Public License 2.0 at https://mozilla.org/MPL/2.0/
// 2020 © io72signals / Antorio Bergasdito

//@version=4
study("72s: Adaptive Hull Moving Average+", shorttitle="72s: Adaptive HMA+", overlay=true)

//Optional Inputs
charger     = input("Volatility", title="Choose which charger to adapt to:", options=["Volatility", "Volume"])
src         = input(close, title="Source:")
minLength   = input(172, title="Minimum period:")
maxLength   = input(233, title="Maximum period:")
adaptPct    = 0.03141 //input(3.141, minval = 0, maxval = 100, title="Adapting Percentage:") / 100.0

flat        = input(17, title="Consolidation area is when slope below:")

showMinor   = input(true, title="Show minor xHMA+", group="Minor Adaptive HMA+ Period")
minorMin    = input(89, title="Minimum:", group="Minor Adaptive HMA+ Period", inline="mHMA+")
minorMax    = input(121, title="Maximum:", group="Minor Adaptive HMA+ Period", inline="mHMA+")

showZone    = input(false, title="Show Adaptive HMA+ Distance Zone", group="DISTANCE ZONE")
mult        = input(2.7, title="Distance (Envelope) Multiplier", step=.1, group="DISTANCE ZONE")

showSignals = input(true, title="Show Possible Signals", group="OTHER")
useBg       = input(true, title="Background color to differentiate movement", group="OTHER")

//Source to adapt to
highVolatility = atr(14) > atr(46)                  //Volatility Meter. Change it to match to your strat/pair/tf if needs.

rsivol  = rsi(volume,14)                            //RSI Volume Osc:
osc     = hma(rsivol,10)                            //Basically it's almost the same as: vol > ma(volume,20)
volBreak = osc > 49                                 //but smoothed using weight to filter noise or catch earlier signs.

//Dynamics
var float dynamicLength = avg(minLength,maxLength)
var float minorLength   = avg(minorMin,minorMax)
plugged = charger=="Volume"? volBreak : highVolatility
dynamicLength   := iff(plugged, max(minLength, dynamicLength * (1 - adaptPct)), min(maxLength, dynamicLength * (1 + adaptPct)))
minorLength     := iff(plugged, max(minorMin, minorLength * (1 - adaptPct)), min(minorMax, minorLength * (1 + adaptPct)))

//Slope calculation to determine whether market is in trend, or in consolidation or choppy, or might about to change current trend
slope_period = 34, range = 25, pi = atan(1) * 4
highestHigh = highest(slope_period), lowestLow = lowest(slope_period)
slope_range = range / (highestHigh - lowestLow) * lowestLow
calcslope(_ma)=>
    dt = (_ma[2] - _ma) / src * slope_range
    c = sqrt(1 + dt * dt)
    xAngle = round(180 * acos(1 / c) / pi)
    maAngle = iff(dt > 0, -xAngle, xAngle)
    maAngle

//MA coloring to mark market dynamics
dynColor(_ma,_col1a,_col1b, _col2a, _col2b, _col0) =>
    slope = calcslope(_ma)
    slope >= flat ? plugged? _col1a : _col1b :
     slope < flat and slope > -flat ? _col0 :
     slope <= -flat ? plugged? _col2a : _col2b : _col0

//Adaptive HMA
xhma(_src,_length) => _return = wma(2 * wma(_src, _length / 2) - wma(_src, _length), floor(sqrt(_length)))

dynamicHMA  = xhma(src,int(dynamicLength))      //<--Batman - Our main xHMA+
minorHMA    = xhma(src,int(minorLength))        //<--Robin  - Faster minor xHMA+ (Optional). Can be use to assist for
                                                //            faster entry, slower exit point, or pullbacks info too.

//Plot
plot(dynamicHMA, "Dynamic HMA+", dynColor(dynamicHMA, #6fbf73, #c0f5ae, #eb4d5c, #f2b1d4, color.yellow), 3)
plot(showMinor? minorHMA:na, "minor HMA+", dynColor(minorHMA, #6fbf73, #c0f5ae, #eb4d5c, #f2b1d4, color.yellow), 1)

//Backgroud coloring
notgreat = calcslope(dynamicHMA) < flat and calcslope(dynamicHMA) > -flat
bgcolor(useBg? plugged? na : notgreat? #757779: #afb4b9 : na)

// Comparative study
// staticHMA = hma(close, 200)
// plot(staticHMA,  "Static HMA")
// plotchar(dynamicLength, "dynamicLengthgth", "", location.top) //check output the calculated Dynamic Length in the Data Window.

//{ DISTANCE ZONE
// Envelope the main DynamicHMA with ATR band, just one way to approximate current price distance to MA. Other usages/methods may vary.
upperTL = dynamicHMA + mult * atr(40)        ,  lowerTL = dynamicHMA - mult * atr(40)           //<--Half distance zone
topTL = dynamicHMA + (mult*2) * atr(40)      ,  botTL = dynamicHMA - (mult*2) * atr(40)         //<--One distance zone
stopupperTL = dynamicHMA + (mult/2) * atr(40),  stoplowerTL = dynamicHMA - (mult/2) * atr(40)   //<--Half of the half. If need ie. tighter SL or trailing

// Plotting Distance Zone
plot(showZone?upperTL:na, color=color.green, transp=72)
plot(showZone?lowerTL:na, color=color.red,   transp=72)
plot(showZone?topTL:na, color=color.gray, transp=72)
plot(showZone?botTL:na, color=color.gray, transp=72)
sutl = plot(showZone?stopupperTL:na, color=color.white, transp=100)
sltl = plot(showZone?stoplowerTL:na, color=color.white, transp=100)
colZone = showZone? color.purple:color.new(color.white,100)
fill(sutl, sltl, color=colZone, transp=90)
//}

//{ SIGNALS
_slope = calcslope(dynamicHMA)

// Entry Base; When HMA+ turn to a darker color and market is out from low volatility.
// Remember to also considering price distance to MA and strength (ie. RSI)
_upSig = _slope >=  flat and plugged
_dnSig = _slope <= -flat and plugged
buy  = _upSig and not _upSig[1]
sell = _dnSig and not _dnSig[1]

// Possible Exits. These only based on faster xHMA+
_upExit = _slope>=flat  and (not plugged) and close<minorHMA
_dnExit = _slope<=-flat and (not plugged) and close>minorHMA
fastExits  = (_upExit and not _upExit[1]) or (_dnExit and not _dnExit[1])

// Caution Sign. When Price crossed most outer distance zone. Could also be a good TP spot if your already in profit
_topWarn    = high>topTL
_botWarn    = low<botTL
warningSigns = (_topWarn and not _topWarn[1]) or (_botWarn and not _botWarn[1])

// Plot 'em up
atrPos = 0.72 * atr(5)
plotchar(showSignals and buy?  dynamicHMA-atrPos: na, color=color.green, location=location.absolute, char="⬆", size = size.tiny)
plotchar(showSignals and sell? dynamicHMA+atrPos: na, color=color.red,   location=location.absolute, char="⬇", size = size.tiny)
plotchar(showSignals and fastExits? _upExit? minorHMA+atrPos: _dnExit? minorHMA-atrPos: na: na,
     color=_upExit?color.green:_dnExit?color.red: na, location=location.absolute, char="ⓧ", size=size.tiny)
plotchar(showSignals and warningSigns? _topWarn? high+atrPos: _botWarn? low-atrPos: na: na,
     color=color.orange, location=location.absolute, char="⚠", size=size.tiny)
//}

//{ ALERTS
// Previous alerts:
// alertcondition(highVolatility and not notgreat, "72s: Volatility Meter", "Market is on the move")
// alertcondition(volBreak[1] and volBreak and not notgreat, "72s: Volume Break", "Volume has just break above average")

// New Alert:
// Delete what alert you don't need:
if buy
    alert("Possible Buy Signal at" + tostring(close), alert.freq_once_per_bar_close)
if sell
    alert("Possible Sell Signal at" + tostring(close), alert.freq_once_per_bar_close)

if fastExits and _upExit
    alert("Price has just crossed down minor xHMA+ at" + tostring(close), alert.freq_once_per_bar_close)
if fastExits and _dnExit
    alert("Price has just crossed up minor xHMA+ at" + tostring(close), alert.freq_once_per_bar_close)

if warningSigns and _topWarn
    alert("Price has just crossed above top xHMA+ zone", alert.freq_once_per_bar_close)
if warningSigns and _botWarn
    alert("Price has just crossed below bottom xHMA+ zone", alert.freq_once_per_bar_close)
//}


if buy
    strategy.entry("Enter Long", strategy.long)
else if sell
    strategy.entry("Enter Short", strategy.short)
- 量MMAベースの適応型ピラミディング ダイナミックストップ・ロス&テイク・プロフィート・トレーディング戦略
- チェンデリア出口
- ミルマシーン
- ホードルライン
- 多粒のバゲット
- フィボナッチ 進み 断片 を 持つ
- 負荷が減る
- アルファトレンド使用
- アルファトレンド
- RSIのトレンド逆転戦略