モメンタムリバーサルインデックス戦略


作成日: 2023-11-02 17:21:45 最終変更日: 2023-11-02 17:21:45
コピー: 1 クリック数: 881
1
フォロー
1617
フォロワー

モメンタムリバーサルインデックス戦略

概要

動量逆転指数 (Relative Momentum Index,RMI) 戦略は,動量指数に基づく改良策である.この戦略は,価格の変化の動力を計算して,市場が過買状態か過売状態にあるかどうかを判断し,逆転の機会を捕捉する.

戦略原則

RMI策の計算式は以下の通りである.

xMom = xPrice - xPrice[Length]  //计算Length周期内的价格变动
xMU = 如果xMom >= 0:之前xMU减去xMU/Length加上xMom;否则:之前xMU 
xMD = 如果xMom <= 0:之前xMD减去xMD/Length加上xMom的绝对值;否则:0
RM = xMU / xMD  
RMI = 100 * (RM / (1 + RM))

この戦略は,まず,Length周期内の価格変化xMomを計算する.xMom>=0であれば,価格上昇を表すxMUはxMomを累積する.xMomであれば,価格低下を表すxMDはxMomを累積する.xMomの絶対値である.RMはxMUとxMDの比であり,下落の強さを表す.RMIはRMを一式化して処理し,0-100の間の指数を得る.

RMIが値SellZoneより高いときは,オーバーバイ,空売り;RMIが値BuyZoneより低いときは,オーバーセール,多売りを意味する.

戦略的優位性

  • RMI指数はRSI指数よりも敏感で,価格逆転の機会を早期に捉えることができます.
  • RMIは,震動の影響を受けないため,下落の強さを測定します.
  • RMIは動力に基づいて,超買超売状態をより正確に判断できます.

戦略リスク

  • 他の反転策と同様に,RMI策略は利の危険性があります.強気な状況では,買点が突破されます.
  • RMIパラメータは,異なる品種に対して最適化する必要があります.そうでなければ,効果が良くないかもしれません.
  • 偽信号が多く発生しないように,合理的な超買超売の設定が必要です.

適切なストップポイントの緩和,パラメータの最適化,トレンド戦略の組み合わせなどの方法でリスクを軽減できます.

戦略の最適化

RMIの戦略は,以下の点で最適化できます.

  • 長さのパラメータを最適化して,戦略の利益を最大化する周期長さを選択します.
  • 偽信号の可能性を減らすために,超買超売の値を最適化します.
  • 単一損失を抑えるための 損失防止メカニズムを 強化する
  • トレンドフォローや均等な戦略と組み合わせると,勝率が上がります.
  • 異なる品種の特性を考慮して適切な取引時間を選択し,戦略の安定性を高めます.

要約する

RMI戦略は,価格動力の変化を測定し,反転操作を行うことで,ショートラインの回転機会を効果的に捕捉できます. RSI戦略と比較して,RMI戦略はより敏感で,震動の影響を受けません. しかし,この戦略は,相場化のリスクが依然として存在し,パラメータを最適化し,トレンド戦略と連携して使用する必要があります.

ストラテジーソースコード
/*backtest
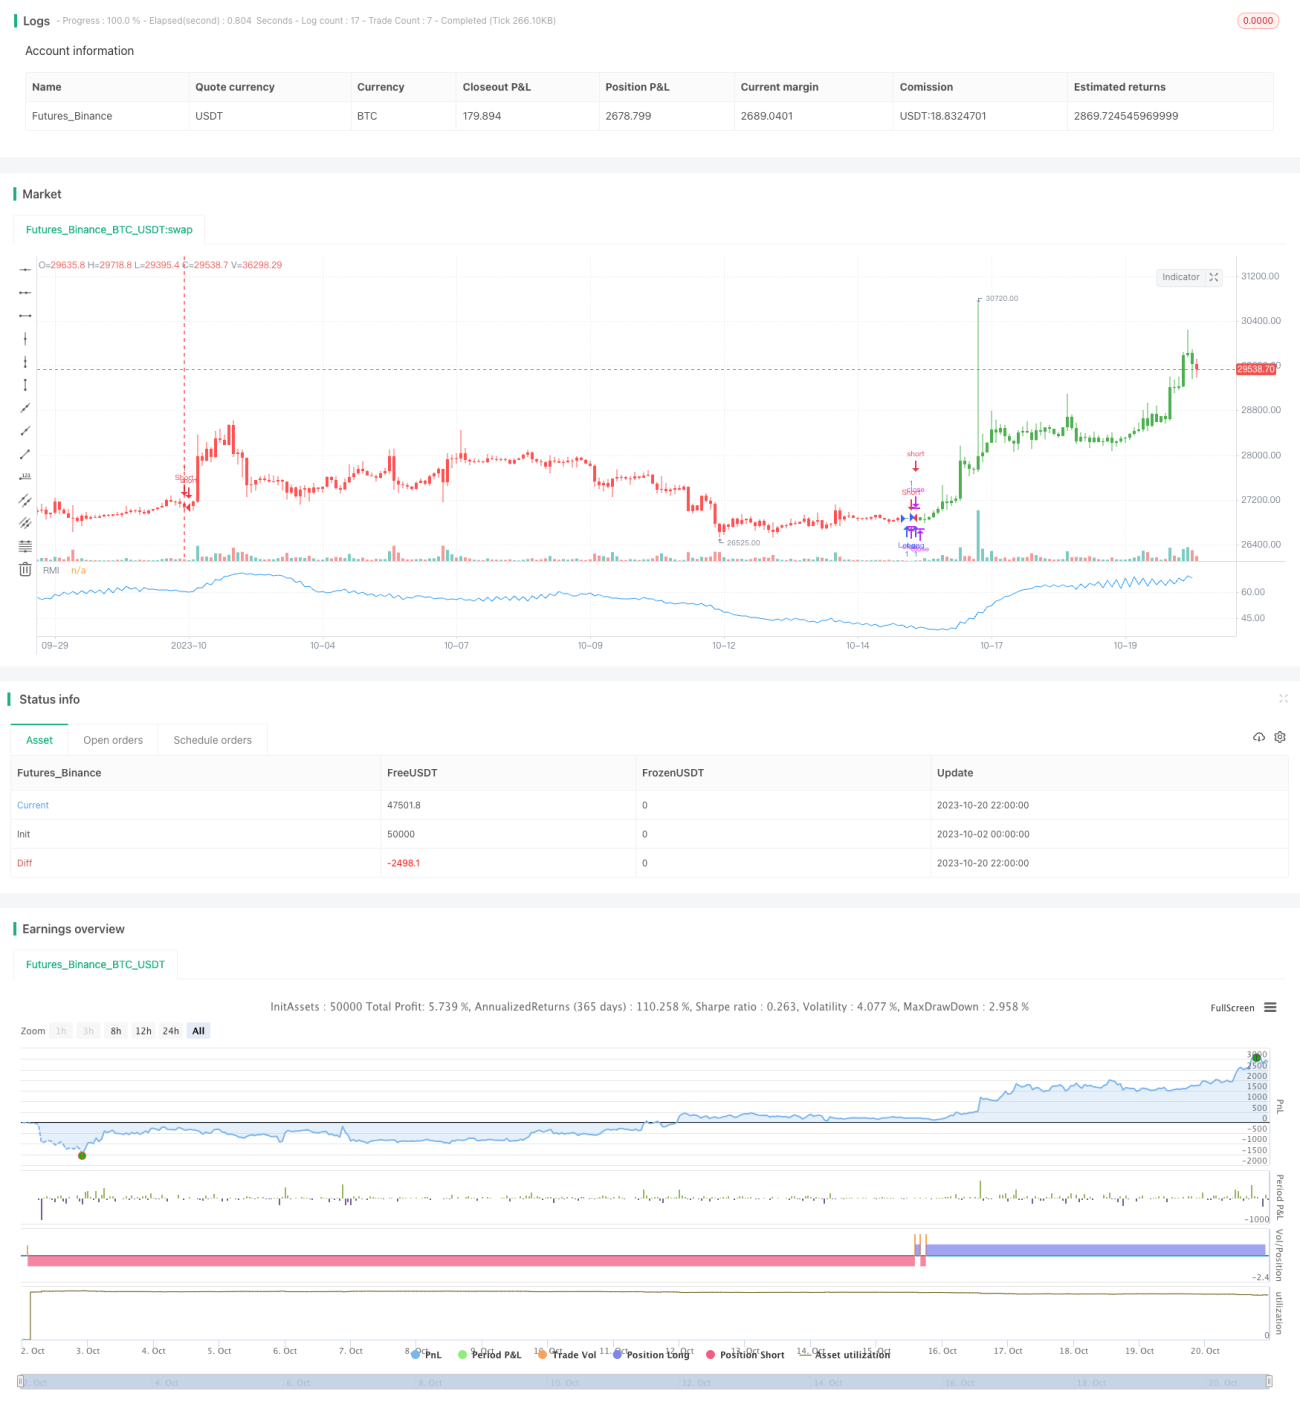
start: 2023-10-02 00:00:00
end: 2023-10-21 00:00:00
period: 2h
basePeriod: 15m
exchanges: [{"eid":"Futures_Binance","currency":"BTC_USDT"}]
*/

//@version=2
////////////////////////////////////////////////////////////
//  Copyright by HPotter v1.0 19/10/2017
// The Relative Momentum Index (RMI) was developed by Roger Altman. Impressed 
// with the Relative Strength Index's sensitivity to the number of look-back 
// periods, yet frustrated with it's inconsistent oscillation between defined 
// overbought and oversold levels, Mr. Altman added a momentum component to the RSI.
// As mentioned, the RMI is a variation of the RSI indicator. Instead of counting 
// up and down days from close to close as the RSI does, the RMI counts up and down 
// days from the close relative to the close x-days ago where x is not necessarily 
// 1 as required by the RSI). So as the name of the indicator reflects, "momentum" is 
// substituted for "strength".   
//
// You can change long to short in the Input Settings
// WARNING:
// - For purpose educate only
// - This script to change bars colors.
////////////////////////////////////////////////////////////
strategy(title="Relative Momentum Index", shorttitle="RMI")
xPrice = close
Length = input(20, minval=1)
BuyZone = input(40, minval=1)
SellZone = input(70, minval=1)
reverse = input(false, title="Trade reverse")
// hline(0, color=gray, linestyle=dashed)
// hline(SellZone, color=red, linestyle=line)
// hline(BuyZone, color=green, linestyle=line)
xMom = xPrice - xPrice[Length]
xMU = iff(xMom >= 0, nz(xMU[1], 1) - (nz(xMU[1],1) / Length) + xMom, nz(xMU[1], 1))
xMD = iff(xMom <= 0, nz(xMD[1], 1) - (nz(xMD[1],1) / Length) + abs(xMom), nz(xMD[1], 0))
RM = xMU / xMD
nRes = 100 * (RM / (1+RM))
pos = iff(nRes < BuyZone, 1,
	   iff(nRes > SellZone, -1, nz(pos[1], 0))) 
possig = iff(reverse and pos == 1, -1,
          iff(reverse and pos == -1, 1, pos))	   
if (possig == 1) 
    strategy.entry("Long", strategy.long)
if (possig == -1)
    strategy.entry("Short", strategy.short)	   	    
barcolor(possig == -1 ? red: possig == 1 ? green : blue )  
plot(nRes, color=blue, title="RMI")