パーセンタイルに基づくハイナッハ移動平均取引戦略
作成日:
2023-12-25 11:02:25
最終変更日:
2023-12-25 11:02:25
コピー:
1
クリック数:
829
1
フォロー
1750
フォロワー
概要
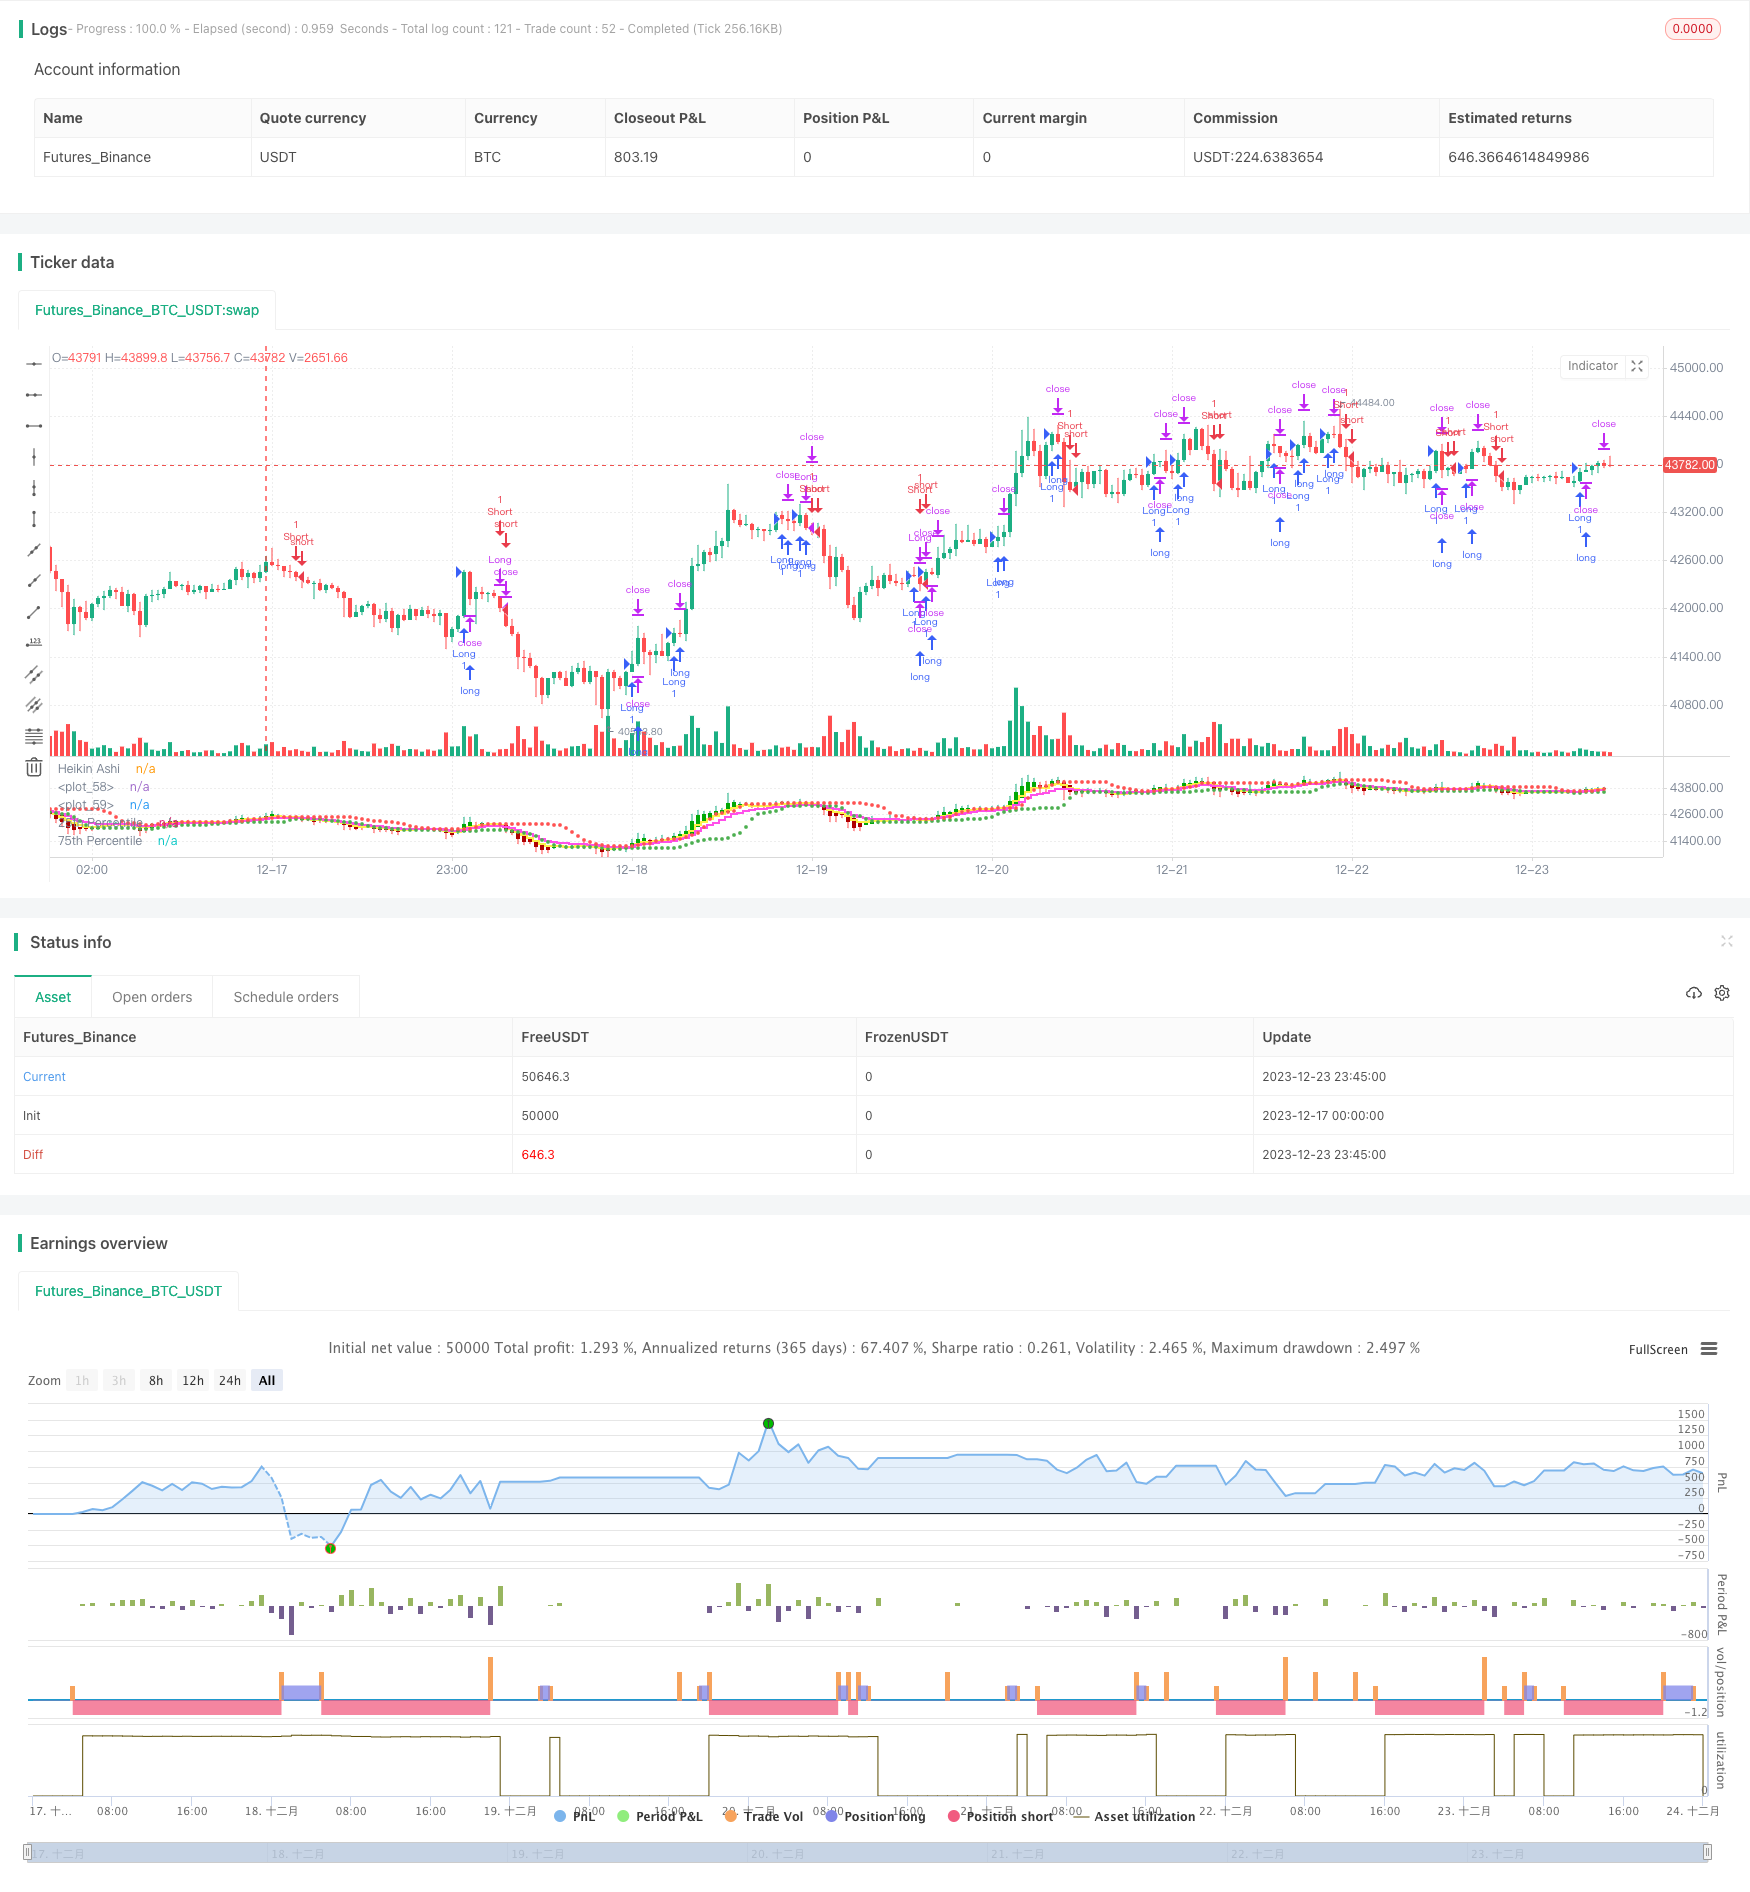
この戦略は,ハインアッシュ平均線での取引シグナルの生成に基づいています. 購入と売却のシグナルの生成は,ハインアッシュの閉盘価格と75パーセントの価格レベルとの交差とハインアッシュの閉盘価格が移動平均より高いという2つの要因を考慮しています.
戦略原則
この戦略は,海因アッシュ平均線を普通K線の代わりに使用して分析する.この平均線は,市場のノイズをフィルターし,トレンドと逆転信号の発見に有利である.具体的には,この戦略は,パーセントチャネルと移動平均を組み合わせて取引信号を生成する.
- ハインアッシュの閉盤の75パーセントの値が買取信号を発生させた.
- ハインアッシュの閉盤価格の下の5日移動平均を突破すると,売り込みシグナルが生じます.
また,単一リスクの管理のために,ストップ・ディスタンスとストップ・トラッキングを設定します.
戦略的優位性
- ハインアッシュ平均線を使用すると,トレンドをより明確に識別し,反転信号を早期に発見できます.
- 百分数チャネルを組み合わせて,価格が過熱状態か過売状態かを判断し,購入と売却のタイミングを判断することができる.
- ストップを設定し,ストップを追跡することで,リスクを積極的にコントロールし,許容範囲を超えた損失を回避できます.
戦略リスク
- ハインアヒ平均線は,それ自体で遅延が生じ,ショートライン操作の最適な位置を逃す可能性があります.
- パーセントチャネルは,価格の転換点を完全に決定することができないので,ある種の偽信号率が存在する.
- ストップダメージ距離の設定が不適切で,余りにも緩やかになり,余りにも緊密になり,結果的に戦略のパフォーマンスに影響する.
上記のリスクを軽減するために,移動平均の周期を適切に調整したり,ストップレッシングを調整したりすることができます.
戦略の最適化
- 異なる移動平均の組み合わせをテストし,最適なパラメータを見つけます.
- 価格の熱帯を捕捉するために,異なるパーセンテージチャネルパラメータをテストします.
- 他の指標と組み合わせて,買取・売却の信号を検証し,偽の信号をフィルターします.
- 動的に止損距離を調整する.
要約する
この戦略は,海因アッシュ平均線,百分位チャネル,移動平均線の複数の指標を統合して,取引システムを形成する.このシステムは,トレンドの方向を効果的に識別し,リスクを制御するためにストップを設定する,検討に値する量化取引戦略である.パラメータの最適化および他の補助指標の追加により,システムの安定性をさらに向上させる見込みである.
ストラテジーソースコード
/*backtest
start: 2023-12-17 00:00:00
end: 2023-12-24 00:00:00
period: 45m
basePeriod: 5m
exchanges: [{"eid":"Futures_Binance","currency":"BTC_USDT"}]
*/

//@version=5
strategy("HK Percentile Interpolation One",shorttitle = "HKPIO", overlay=false, default_qty_type = strategy.cash, default_qty_value = 5000, calc_on_order_fills = true, calc_on_every_tick = true)

// Input parameters
stopLossPercentage = input(3, title="Stop Loss (%)") // User can set Stop Loss as a percentage
trailStopPercentage = input(1.5, title="Trailing Stop (%)") // User can set Trailing Stop as a percentage
lookback = input.int(14, title="Lookback Period", minval=1) // User can set the lookback period for percentile calculation
yellowLine_length = input.int(5, "Yellow", minval=1) // User can set the length for Yellow EMA
purplLine_length = input.int(10, "Purple", minval=1) // User can set the length for Purple EMA
holdPeriod = input.int(200, title="Minimum Holding Period", minval=10) // User can set the minimum holding period
startDate = timestamp("2021 01 01")  // User can set the start date for the strategy

// Calculate Heikin Ashi values
haClose = ohlc4
var float haOpen = na
haOpen := na(haOpen[1]) ? (open + close) / 2 : (haOpen[1] + haClose[1]) / 2
haHigh = math.max(nz(haOpen, high), nz(haClose, high), high)
haLow = math.min(nz(haOpen, low), nz(haClose, low), low)

// Calculate Moving Averages
yellowLine = ta.ema(haClose, yellowLine_length)
purplLine = ta.ema(haClose, purplLine_length)

// Calculate 25th and 75th percentiles
p25 = ta.percentile_linear_interpolation(haClose, lookback, 28)
p75 = ta.percentile_linear_interpolation(haClose, lookback, 78)

// Generate buy/sell signals
longSignal = ta.crossover(haClose, p75) and haClose > yellowLine
sellSignal = ta.crossunder(haClose, yellowLine)
longSignal1 = ta.crossover(haClose, p75) and haClose > purplLine
sellSignal1 = ta.crossunder(haClose, purplLine)

// Set start time and trade conditions
if(time >= startDate)
    // When longSignal is true, enter a long trade and set stop loss and trailing stop conditions
    if (longSignal)
        strategy.entry("Long", strategy.long, 1)
        strategy.exit("Sell", "Long", stop=close*(1-stopLossPercentage/100), trail_points=close*trailStopPercentage/100, trail_offset=close*trailStopPercentage/100)
    // When sellSignal is true, close the long trade
    if (sellSignal)
        strategy.close("Long")
    // When sellSignal1 is true, enter a short trade
    if (sellSignal1)
        strategy.entry("Short", strategy.short, 1)
    // When longSignal1 is true, close the short trade
    if (longSignal1)
        strategy.close("Short")

// Plot Heikin Ashi candles
plotcandle(haOpen, haHigh, haLow, haClose, title="Heikin Ashi", color=(haClose >= haOpen ? color.rgb(1, 168, 6) : color.rgb(176, 0, 0)))

// Plot 25th and 75th percentile levels
plot(p25, title="25th Percentile", color=color.green, linewidth=1, style=plot.style_circles)
plot(p75, title="75th Percentile", color=color.red, linewidth=1, style=plot.style_circles)

// Plot Moving Averages
plot(yellowLine, color = color.rgb(254, 242, 73, 2), linewidth = 2, style = plot.style_stepline)
plot(purplLine, color = color.rgb(255, 77, 234, 2), linewidth = 2, style = plot.style_stepline)