T3インジケーターに基づくトレンドフォロー取引戦略
作成日:
2024-01-18 16:21:40
最終変更日:
2024-01-18 16:21:40
コピー:
2
クリック数:
1194
1
フォロー
1750
フォロワー
戦略概要
この戦略は,T3移動平均指標に基づいてトレンド追跡取引システムを設計した.このシステムは,価格のトレンドの方向を自動的に認識し,それに応じて空白を多めにします.価格が上昇すると多めにし,価格が下がると空白を多めにします.このシステムは,反転取引の機能もあります.
戦略原則
この戦略は,価格の傾向の方向を判断するためにT3指標を使用する.T3指標は,価格の変化により迅速に反応できるより高い感度を持つ自主移動平均である.この指標の計算式は次のとおりです.
T3(n) = GD(GD(GD(n)))
その中で,GDはDEMAを意味する.計算式は以下の通りである.
GD(n,v) = EMA(n) * (1+v)-EMA(EMA(n)) * v
vは量因子であり,移動平均が価格の線形的な傾向に対する反応の感受性を決定する.v=0時,GD=EMA;v=1時,GD=DEMA.著者はv=0.7を設定することを推奨する.
この戦略は,T3指数と価格を対比して,T3上を穿越したときに価格上昇傾向と判断し,多額;T3下を穿越したときに価格低下傾向と判断し,空白する.
戦略的優位性
- 適応性移動平均T3指標を使用して,価格傾向の変化に敏感に反応する
- 価格の動向を自動的に判断する
- 配置可能な反転取引,市場の変化に対応する柔軟性
戦略リスク
- T3指数では,収算の振動が起こり,トレンドの方向を判断するのが困難である場合
- 適応型移動平均指標は誤差信号を発生しやすい
- 逆転取引のリスク管理は慎重に
T3指標のパラメータを調整したり,他の指標のフィルターを追加したりして誤取引を減らすことができます.また,単発損失を制御するためにストップロスを設定することもできます.
戦略最適化の方向性
- MACD,RSIなどの他の指標の波を組み合わせる
- 傾向判断のルールを追加し,波動市場での誤操作を避ける
- 最適化パラメータ,よりよいパラメータの組み合わせを得るためにvの値を調整する
- ストップダストロジック
要約する
この戦略は,T3指標によって価格トレンドの方向を自動的に判断し,人工判断を必要とせず,自動的に空白を余分にすることができます.また,より複雑な市場状況に対応するために逆転取引ロジックを配置できます.指標パラメータ,取引ロジックなどに最適化余地があり,戦略のパフォーマンスをより優れたものにすることができます.
ストラテジーソースコード
/*backtest
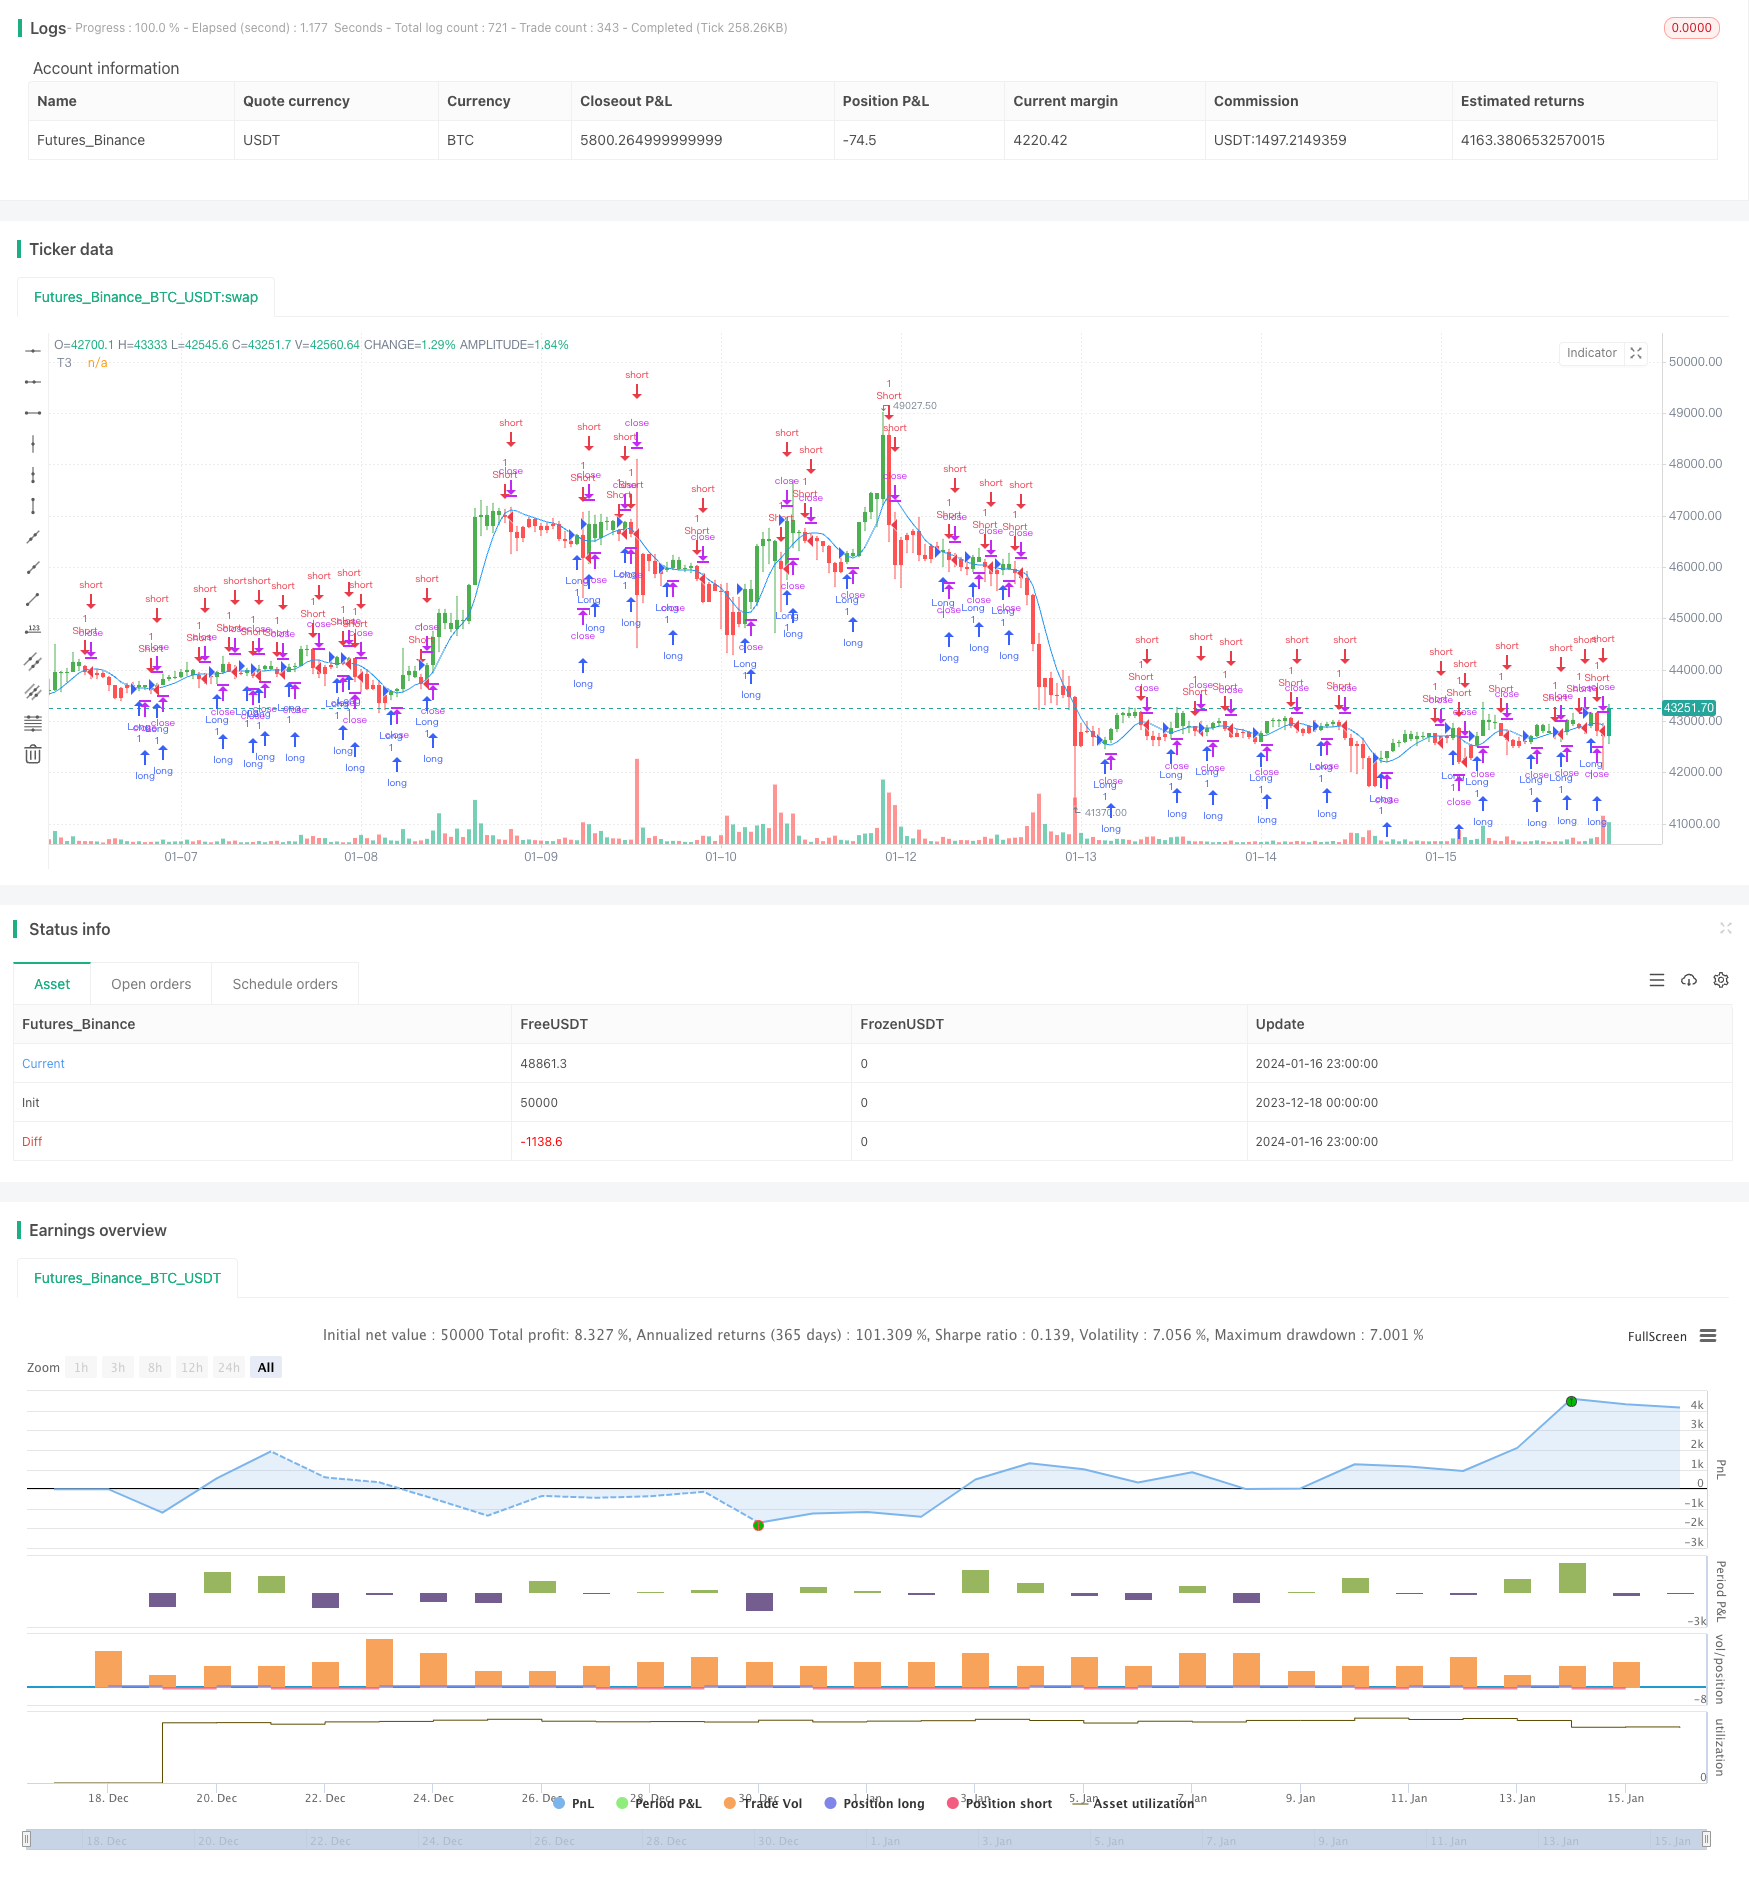
start: 2023-12-18 00:00:00
end: 2024-01-17 00:00:00
period: 1h
basePeriod: 15m
exchanges: [{"eid":"Futures_Binance","currency":"BTC_USDT"}]
*/
//@version=2
////////////////////////////////////////////////////////////
// Copyright by HPotter v1.00 29/11/2017
// This indicator plots the moving average described in the January, 1998 issue
// of S&C, p.57, "Smoothing Techniques for More Accurate Signals", by Tim Tillson.
// This indicator plots T3 moving average presented in Figure 4 in the article.
// T3 indicator is a moving average which is calculated according to formula:
// T3(n) = GD(GD(GD(n))),
// where GD - generalized DEMA (Double EMA) and calculating according to this:
// GD(n,v) = EMA(n) * (1+v)-EMA(EMA(n)) * v,
// where "v" is volume factor, which determines how hot the moving average’s response
// to linear trends will be. The author advises to use v=0.7.
// When v = 0, GD = EMA, and when v = 1, GD = DEMA. In between, GD is a less aggressive
// version of DEMA. By using a value for v less than1, trader cure the multiple DEMA
// overshoot problem but at the cost of accepting some additional phase delay.
// In filter theory terminology, T3 is a six-pole nonlinear Kalman filter. Kalman
// filters are ones that use the error — in this case, (time series - EMA(n)) —
// to correct themselves. In the realm of technical analysis, these are called adaptive
// moving averages; they track the time series more aggres-sively when it is making large
// moves. Tim Tillson is a software project manager at Hewlett-Packard, with degrees in
// mathematics and computer science. He has privately traded options and equities for 15 years.
//
// You can change long to short in the Input Settings
// WARNING:
// - For purpose educate only
// - This script to change bars colors.
////////////////////////////////////////////////////////////
strategy(title="T3 Averages", shorttitle="T3", overlay = true)
Length = input(5, minval=1)
b = input(0.7, minval=0.01,step=0.01)
reverse = input(false, title="Trade reverse")
xPrice = close
xe1 = ema(xPrice, Length)
xe2 = ema(xe1, Length)
xe3 = ema(xe2, Length)
xe4 = ema(xe3, Length)
xe5 = ema(xe4, Length)
xe6 = ema(xe5, Length)
c1 = -b*b*b
c2 = 3*b*b+3*b*b*b
c3 = -6*b*b-3*b-3*b*b*b
c4 = 1+3*b+b*b*b+3*b*b
nT3Average = c1 * xe6 + c2 * xe5 + c3 * xe4 + c4 * xe3
pos = iff(nT3Average > close, -1,
iff(nT3Average < close, 1, nz(pos[1], 0)))
possig = iff(reverse and pos == 1, -1,
iff(reverse and pos == -1, 1, pos))
if (possig == 1)
strategy.entry("Long", strategy.long)
if (possig == -1)
strategy.entry("Short", strategy.short)
barcolor(possig == -1 ? red: possig == 1 ? green : blue )
plot(nT3Average, color=blue, title="T3")