RSI Reversal Strategy

Author: ChaoZhang, Date: 2024-01-19 14:24:09
Tags:

img

Overview

The RSI reversal strategy calculates the RSI indicator and smoothed moving average to determine if a stock is overbought or oversold, thereby generating buy and sell signals. This strategy leverages the reversal characteristic of the RSI indicator to profit when stock prices reverse.

Strategy Logic

The strategy first calculates the 14-period RSI and normalizes it to 0-100. Then it calculates the 5-period weighted moving average of RSI, and maps it to -1 to 1 using the tangent function. When the mapped RSI crosses above -0.8, a buy signal is generated. When it crosses below 1, a sell signal is generated. The mapping and threshold judgement methods are used here to detect the reversal signals of the RSI indicator.

The strategy also sets the running month and date range so that it only runs during specified months and dates.

Advantages

  • Utilizes the reversal characteristic of RSI indicator to generate trading signals at price reversal points and capture reversal opportunities.
  • Mapping and threshold judgement on RSI make the signals clearer.
  • Configurable running months and dates, flexible to utilize.

Risks

  • RSI reversal signals may have false signals, resulting in incorrect trading signals. This can be reduced by adjusting RSI parameters or adding other filters.
  • Relying solely on a single RSI indicator makes it vulnerable to fake signals. Adding other indicators or factors can improve strategy stability.
  • Fixed months and date range may miss trading opportunities during other time periods. More flexible running time can be configured.

Optimization Directions

  • Test more parameter combinations to find optimal matches between RSI and moving average periods.
  • Add indicators like volume or volatility to confirm reversal signals and reduce false signals.
  • Optimize and adjust the running months and date range to cover more trading opportunities.
  • Add stop loss mechanisms to control risks.

Summary

The RSI reversal strategy effectively captures price reversal opportunities by constructing simple reversal trading rules based on the RSI indicator. The strategy is easy to implement, but can be enhanced via parameter optimization, risk control mechanisms etc, making it a stable profitable quantitative trading strategy.


/*backtest
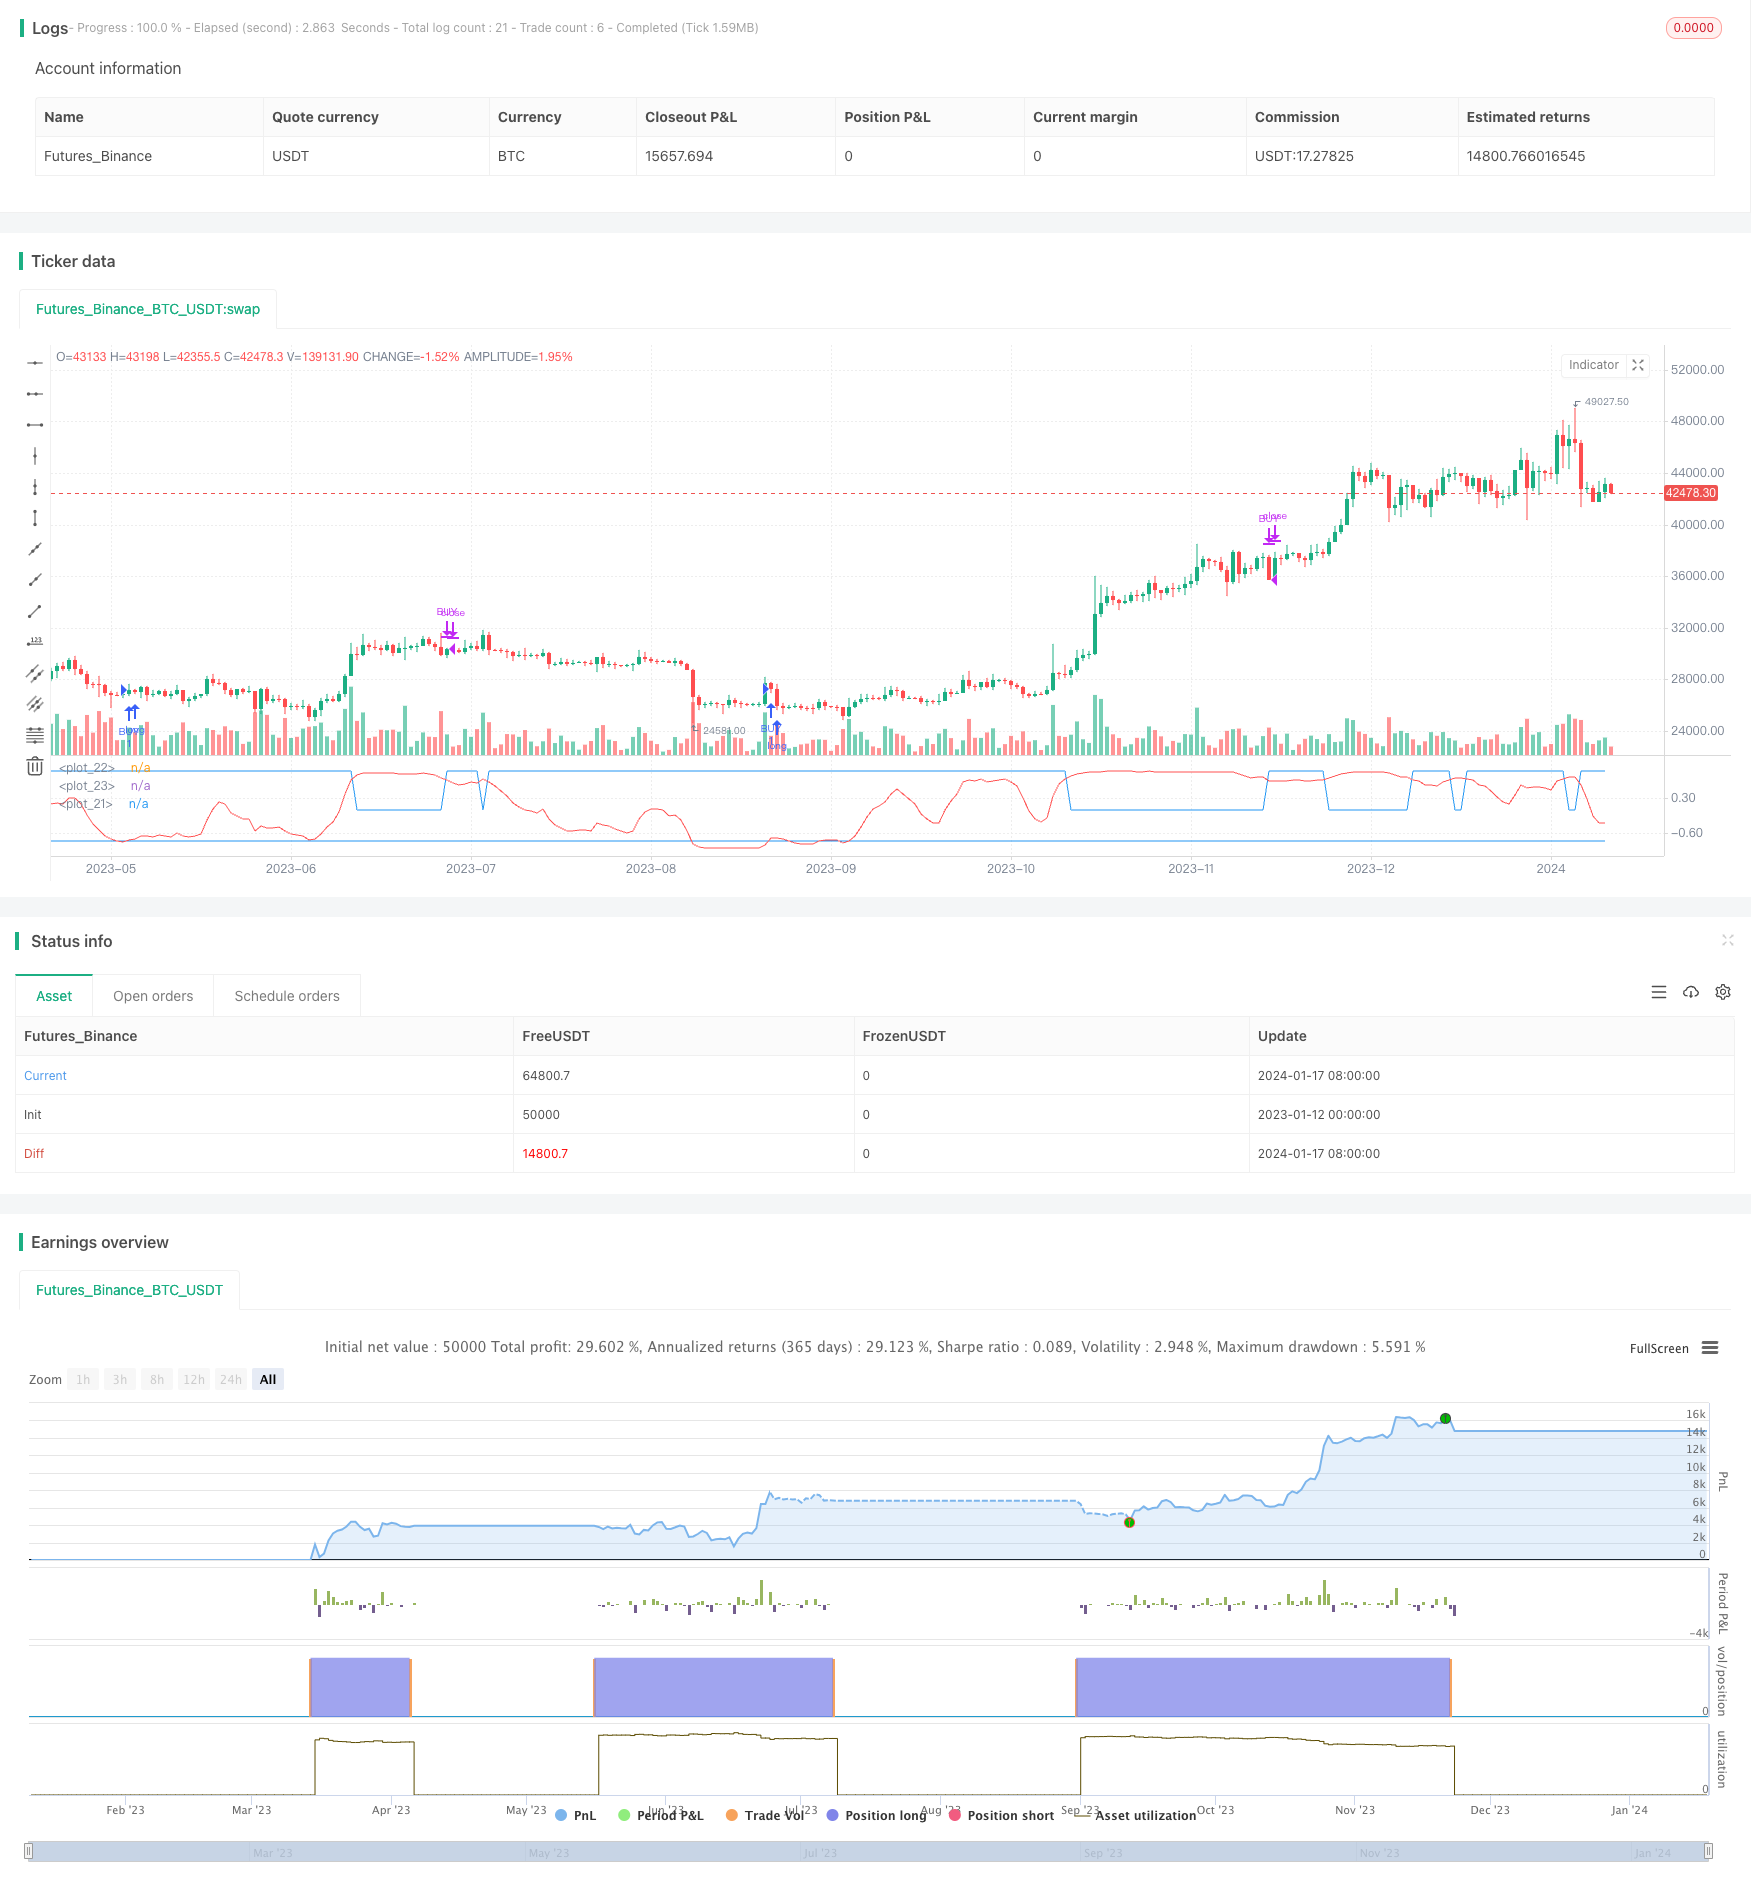
start: 2023-01-12 00:00:00
end: 2024-01-18 00:00:00
period: 1d
basePeriod: 1h
exchanges: [{"eid":"Futures_Binance","currency":"BTC_USDT"}]
*/

//@version=3
strategy(title="RSI Reverse", shorttitle="RSI Reverse")


RSI_main = input(14, title="RSI Main Period")
RSI_smooth = input(5, title="RSI Smooth Period")

//Functions
RVS(input) => (exp(2*input)-1) / (exp(2*input)+1)

//RSI Calculation
raw_RSI=0.1*(rsi(close,RSI_main)-50)
wma_RSI=wma(raw_RSI,RSI_smooth)
RVS_RSI = RVS(wma_RSI)


threshold1 = RVS_RSI < 0.8? 1 : 0
threshold2 = -0.8


plot(RVS_RSI,color=red)
plot(threshold1,color=blue)
plot(threshold2,color=blue)

buycon = crossover(RVS_RSI,threshold2)
sellcon = crossunder(RVS_RSI , threshold1)

monthfrom =input(6)
monthuntil =input(12)
dayfrom=input(1)
dayuntil=input(31)


if (  buycon  ) 
    strategy.entry("BUY", strategy.long, stop=close, oca_name="TREND", comment="BUY")
    
else
    strategy.cancel(id="BUY")


if ( sellcon) 

    strategy.close("BUY")


More