지표: 웨브트렌드 오시레이터
저자:차오장, 날짜: 2022-05-06 18:40:27태그:EMASMA
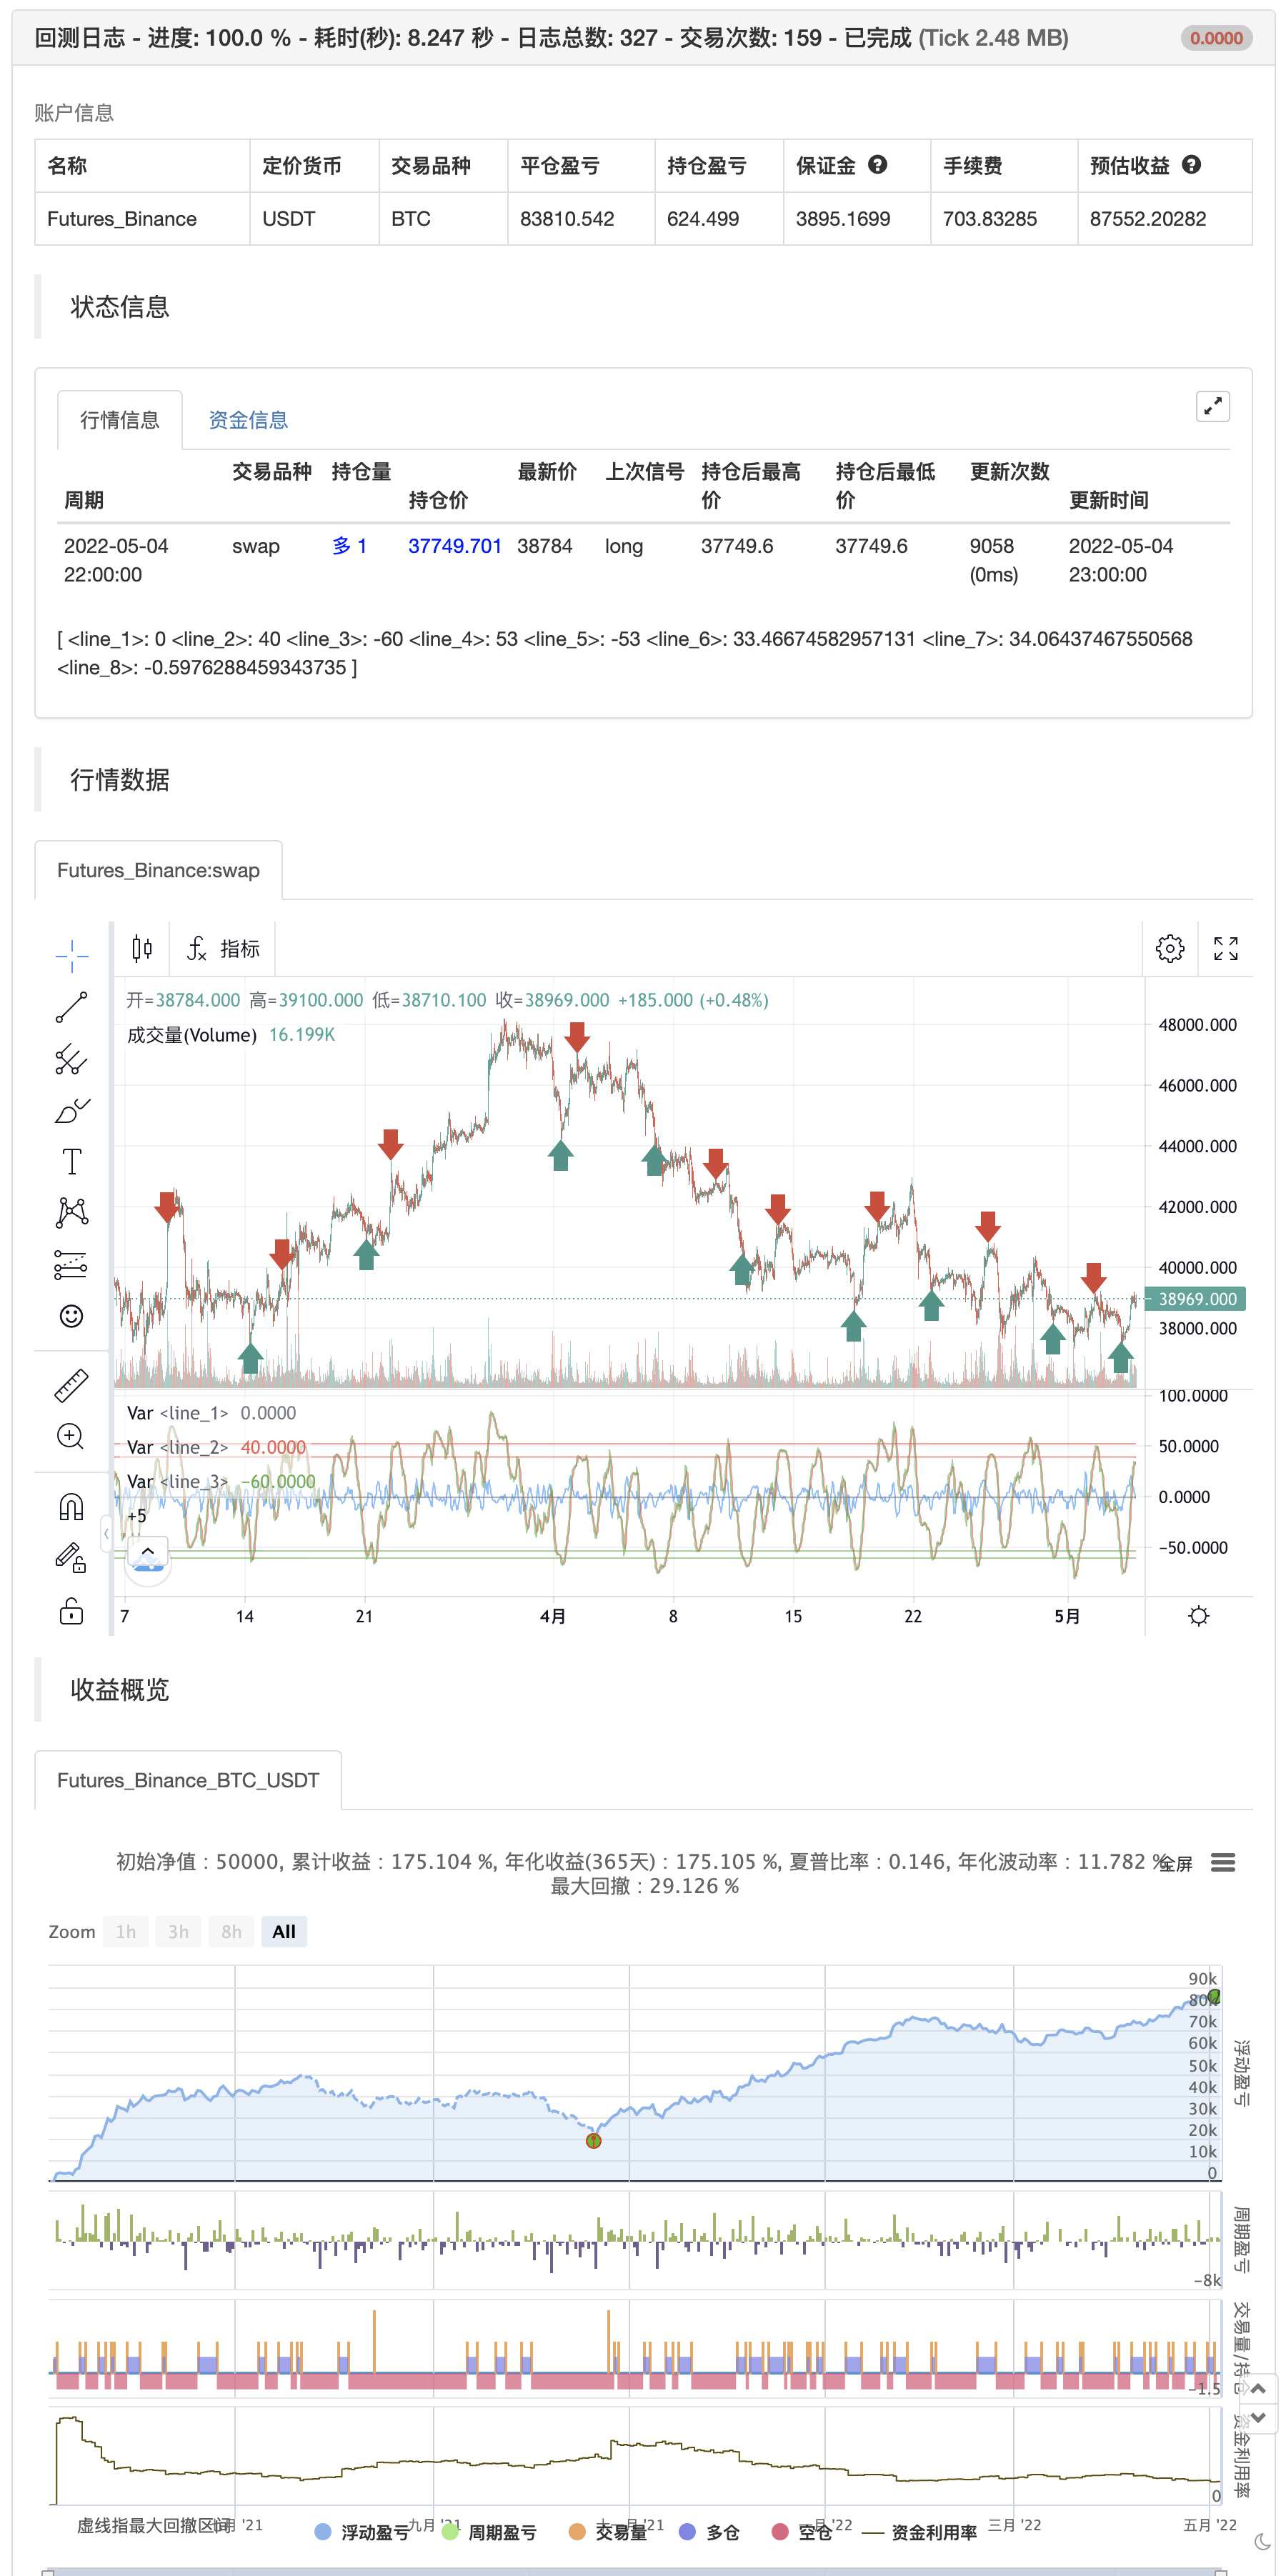
웨이브트렌드 오시레이터는 유명한 TS/MT 지표의 포트입니다. 오시일레이터가 오버쇼프트 밴드 (붉은 선) 위를 넘어서 신호 (점점 선) 아래를 넘어가면 일반적으로 좋은 SELL 신호입니다. 마찬가지로 오시일레이터가 오버쇼프트 밴드 (녹색 선) 아래에서 신호 위를 넘어가면 좋은 BUY 신호입니다.
위의 차트에서 몇 가지 교차점을 표시했습니다. 볼 수 있듯이, 그들은아니WT가 생성하는 유일한 유용한 신호입니다.
재검토
/*backtest
start: 2021-05-05 00:00:00
end: 2022-05-04 23:59:00
period: 1h
basePeriod: 15m
exchanges: [{"eid":"Futures_Binance","currency":"BTC_USDT"}]
args: [["v_input_3",40]]
*/

//
// @author LazyBear
//
// If you use this code in its original/modified form, do drop me a note.
//
study(title="WaveTrend [LazyBear]", shorttitle="WT_LB")
n1 = input(10, "Channel Length")
n2 = input(21, "Average Length")
obLevel1 = input(60, "Over Bought Level 1")
obLevel2 = input(53, "Over Bought Level 2")
osLevel1 = input(-60, "Over Sold Level 1")
osLevel2 = input(-53, "Over Sold Level 2")

ap = hlc3
esa = ta.ema(ap, n1)
d = ta.ema(math.abs(ap - esa), n1)
ci = (ap - esa) / (0.015 * d)
tci = ta.ema(ci, n2)

wt1 = tci
wt2 = ta.sma(wt1,4)

plot(0, color=color.gray)
plot(obLevel1, color=color.red)
plot(osLevel1, color=color.green)
plot(obLevel2, color=color.red, style=3)
plot(osLevel2, color=color.green, style=3)

plot(wt1, color=color.green)
plot(wt2, color=color.red, style=3)
plot(wt1-wt2, color=color.blue, transp=80)
if wt1 >obLevel1
    strategy.entry("entry short", strategy.short)
else if wt1 < osLevel1
    strategy.entry("entry long", strategy.long)
관련
- AMACD - 모든 이동 평균 컨버전스 디버전스
- 거래 ABC
- SSL 채널
- 헬스-4에마
- Bollinger Awesome 알렛 R1
- HALFTREND + HEMA + SMA (거짓 신호의 전략)
- MA 하이브리드 BY RAJ
- 이동 평균과 볼린거 대역에 기초한 양적 거래 전략
- 이동 평균 크로스 알림, 다중 시간 프레임 (MTF)
- ML 경고 템플릿
더 많은