피브 포인트 슈퍼트렌드
저자:차오장, 날짜: 2022-05-17 15:45:37태그:피브ATR
안녕하세요
많은 종류의 슈퍼트렌드가 있습니다. 최근에 저는 피보트 포인트에 기반한 슈퍼트렌드를 생각했고,
이 스크립트 뒤에 있는 아이디어는 피보트 포인트를 찾는 것입니다. 그 중 평균을 계산하고 슈퍼트렌드처럼 ATR에 의해 더 높은 / 낮은 대역을 생성합니다. 알고리즘에서 볼 수 있듯이 스크립트는 과거의 피보트 포인트에 무게를 부여합니다. 이것은 약간 부드럽게 하기 위해 수행됩니다.
백테스트
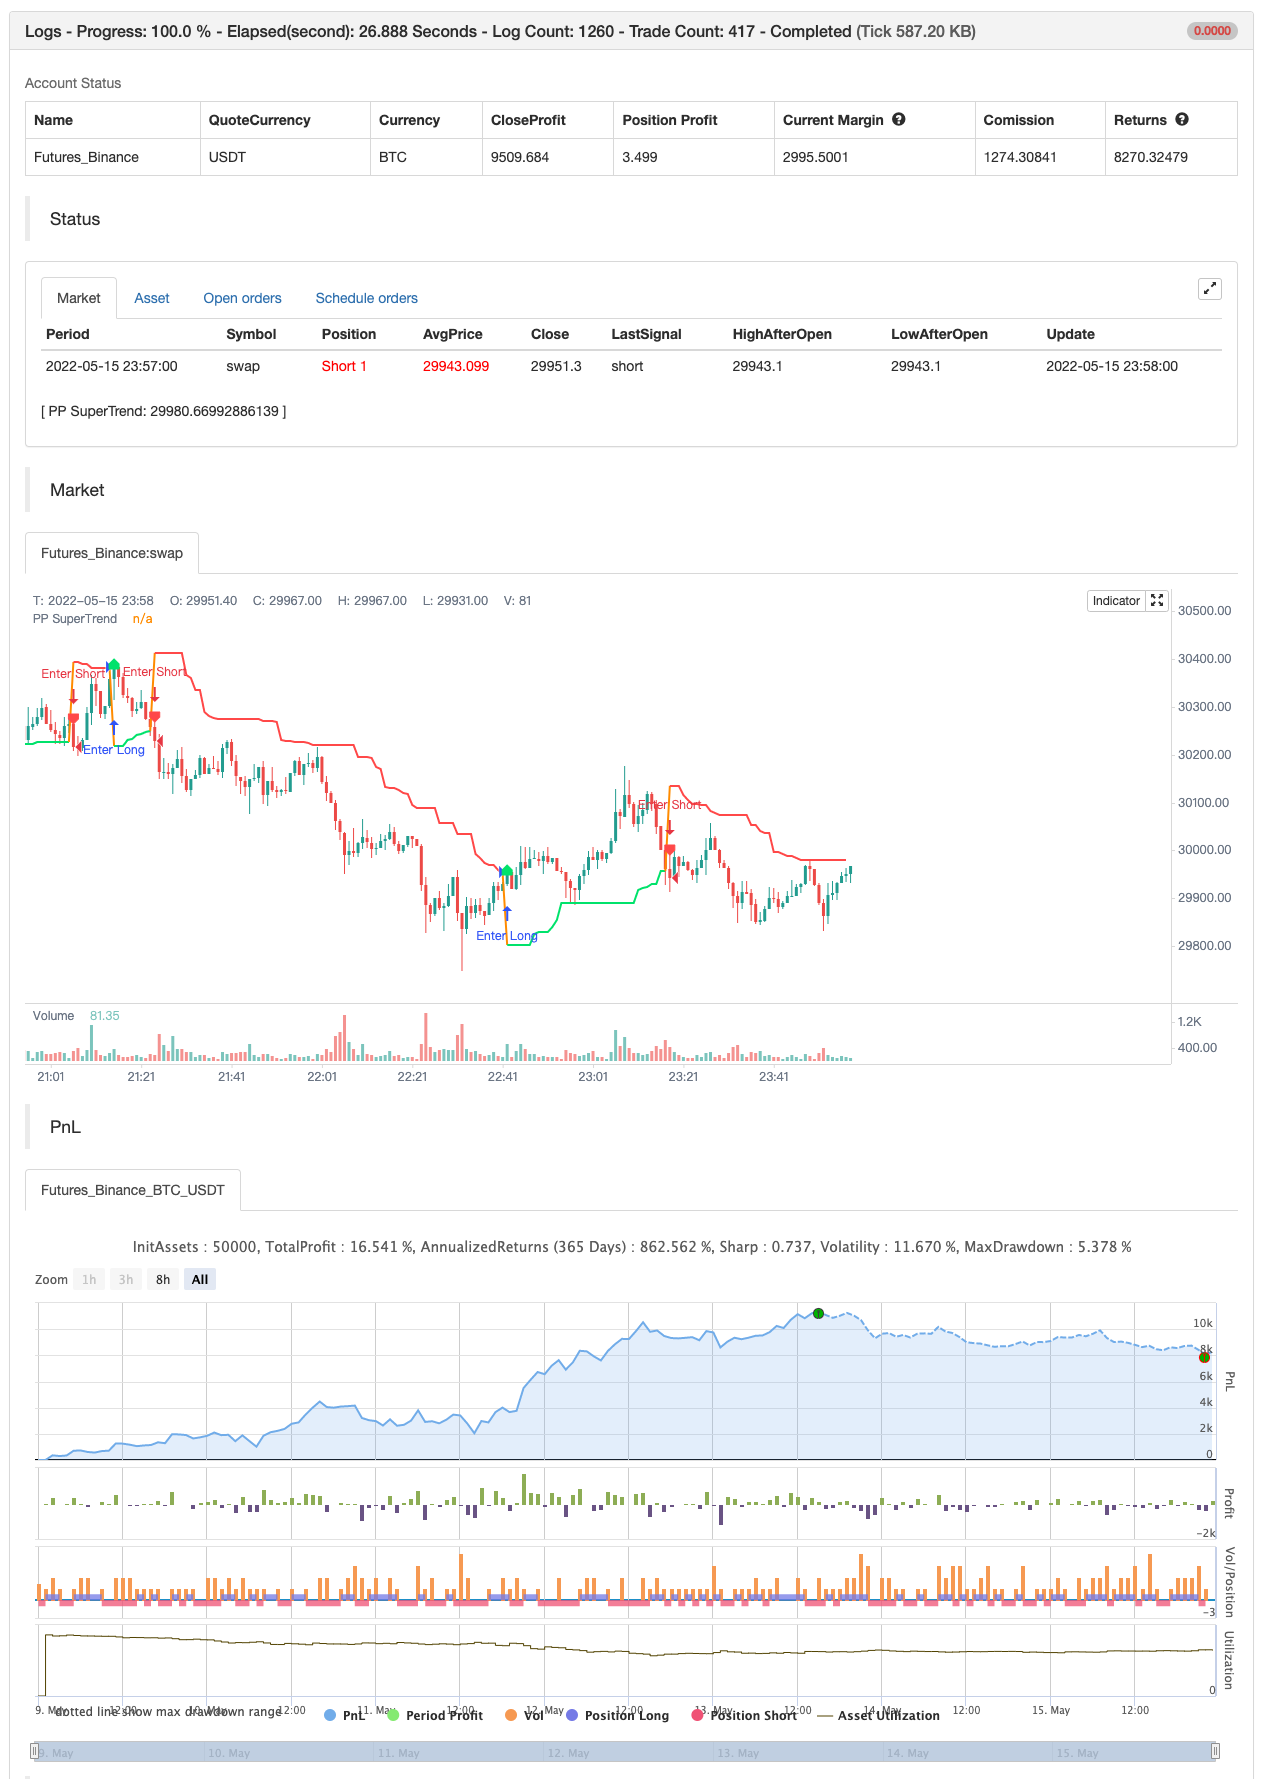
/*backtest
start: 2022-05-09 00:00:00
end: 2022-05-15 23:59:00
period: 1m
basePeriod: 1m
exchanges: [{"eid":"Futures_Binance","currency":"BTC_USDT"}]
*/

// This source code is subject to the terms of the Mozilla Public License 2.0 at https://mozilla.org/MPL/2.0/
// © LonesomeTheBlue

//@version=4
study("Pivot Point SuperTrend", overlay = true)
prd = input(defval = 3, title="Pivot Point Period", minval = 1, maxval = 50)
Factor=input(defval = 2, title = "ATR Factor", minval = 1, step = 0.1)
Pd=input(defval = 6, title = "ATR Period", minval=1)
showpivot = input(defval = false, title="Show Pivot Points")
showlabel = input(defval = true, title="Show Buy/Sell Labels")
showcl = input(defval = false, title="Show PP Center Line")
showsr = input(defval = false, title="Show Support/Resistance")

// get Pivot High/Low
float ph = pivothigh(prd, prd)
float pl = pivotlow(prd, prd)

// drawl Pivot Points if "showpivot" is enabled
plotshape(ph and showpivot, text="H",  style=shape.labeldown, color=na, textcolor=color.red, location=location.abovebar, transp=0, offset = -prd)
plotshape(pl and showpivot, text="L",  style=shape.labeldown, color=na, textcolor=color.lime, location=location.belowbar, transp=0, offset = -prd)

// calculate the Center line using pivot points
var float center = na
float lastpp = ph ? ph : pl ? pl : na
if lastpp
    if na(center)
        center := lastpp
    else
        //weighted calculation
        center := (center * 2 + lastpp) / 3

// upper/lower bands calculation
Up = center - (Factor * atr(Pd))
Dn = center + (Factor * atr(Pd))

// get the trend
float TUp = na
float TDown = na
Trend = 0
TUp := close[1] > TUp[1] ? max(Up, TUp[1]) : Up
TDown := close[1] < TDown[1] ? min(Dn, TDown[1]) : Dn
Trend := close > TDown[1] ? 1: close < TUp[1]? -1: nz(Trend[1], 1)
Trailingsl = Trend == 1 ? TUp : TDown

// plot the trend
linecolor = Trend == 1 and nz(Trend[1]) == 1 ? color.lime : Trend == -1 and nz(Trend[1]) == -1 ? color.red : na
plot(Trailingsl, color = linecolor ,  linewidth = 2, title = "PP SuperTrend")

plot(showcl ? center : na, color = showcl ? center < hl2 ? color.blue : color.red : na)

// check and plot the signals
bsignal = Trend == 1 and Trend[1] == -1
ssignal = Trend == -1 and Trend[1] == 1
plotshape(bsignal and showlabel ? Trailingsl : na, title="Buy", text="Buy", location = location.absolute, style = shape.labelup, size = size.tiny, color = color.lime, textcolor = color.black, transp = 0)
plotshape(ssignal and showlabel ? Trailingsl : na, title="Sell", text="Sell", location = location.absolute, style = shape.labeldown, size = size.tiny, color = color.red, textcolor = color.white, transp = 0)

//get S/R levels using Pivot Points
float resistance = na
float support = na
support := pl ? pl : support[1]
resistance := ph ? ph : resistance[1]

// if enabled then show S/R levels
plot(showsr and support ? support : na, color = showsr and support ? color.lime : na, style = plot.style_circles, offset = -prd)
plot(showsr and resistance ? resistance : na, color = showsr and resistance ? color.red : na, style = plot.style_circles, offset = -prd)

// alerts
alertcondition(Trend == 1 and Trend[1] == -1, title='Buy Signal', message='Buy Signal')
alertcondition(Trend == -1 and Trend[1] == 1, title='Sell Signal', message='Sell Signal')
alertcondition(change(Trend), title='Trend Changed', message='Trend Changed')


if Trend == 1 and Trend[1] == -1
    strategy.entry("Enter Long", strategy.long)
else if Trend == -1 and Trend[1] == 1
    strategy.entry("Enter Short", strategy.short)
관련
- 빌라 다이내믹 피보트 슈퍼트렌드 전략
- 파업 을 가진 피보나치 순서
- 다곡물 바게트
- 수퍼트렌드 ATR TRAILING STOP LOSS
- 밀레 머신
- 캔들리어 출구
- 알파 트렌드 사용
- 회전 순서 블록
- 회전점 높은 낮은 멀티 시간 프레임
- 피보트 기반 후속 최대 & 최소
더 많은