후쿠이즈 트렌드
저자:차오장, 날짜: 2022-05-18 10:25:47태그:RMARSI
이 지표는 2개의 다른 기간의 RSI를 기반으로 합니다.
# RSI에 대한 간략한 소개 # 상대적 강도 지수 (RSI) 는 기술 분석에서 최근 가격 변화의 크기를 측정하여 주식 또는 다른 자산의 가격에서 과반 구매 또는 과반 판매 조건을 평가하는 운동 지표입니다. RSI는 오시일레이터 (두 극단 사이에서 움직이는 선 그래프) 로 표시되며 0에서 100까지 읽을 수 있습니다. 지표는 원래 J. Welles Wilder Jr.에 의해 개발되어 1978년 그의 저명한 책?? New Concepts in Technical Trading Systems?? 에서 소개되었습니다.
전통적 해석과 사용은 70 이상의 값은 증권이 과잉 매입되거나 과평가되고 있으며 트렌드 역전 또는 가격의 교정 인기를 위해 준비 될 수 있음을 나타냅니다. 30 이상의 RSI 판독은 과판 또는 과대평가 상태를 나타냅니다.
# 이 지표에서 # 2개의 RSI를 사용해서 상승 추세와 하락 추세를 나타낼 수 있습니다.
#단기 및 긴 RSI 교차 사이의 조건# 크로스오버 = 상승 추세 (블루존) 크로스 서더 = 하락 추세 (붉은 구역)
백테스팅
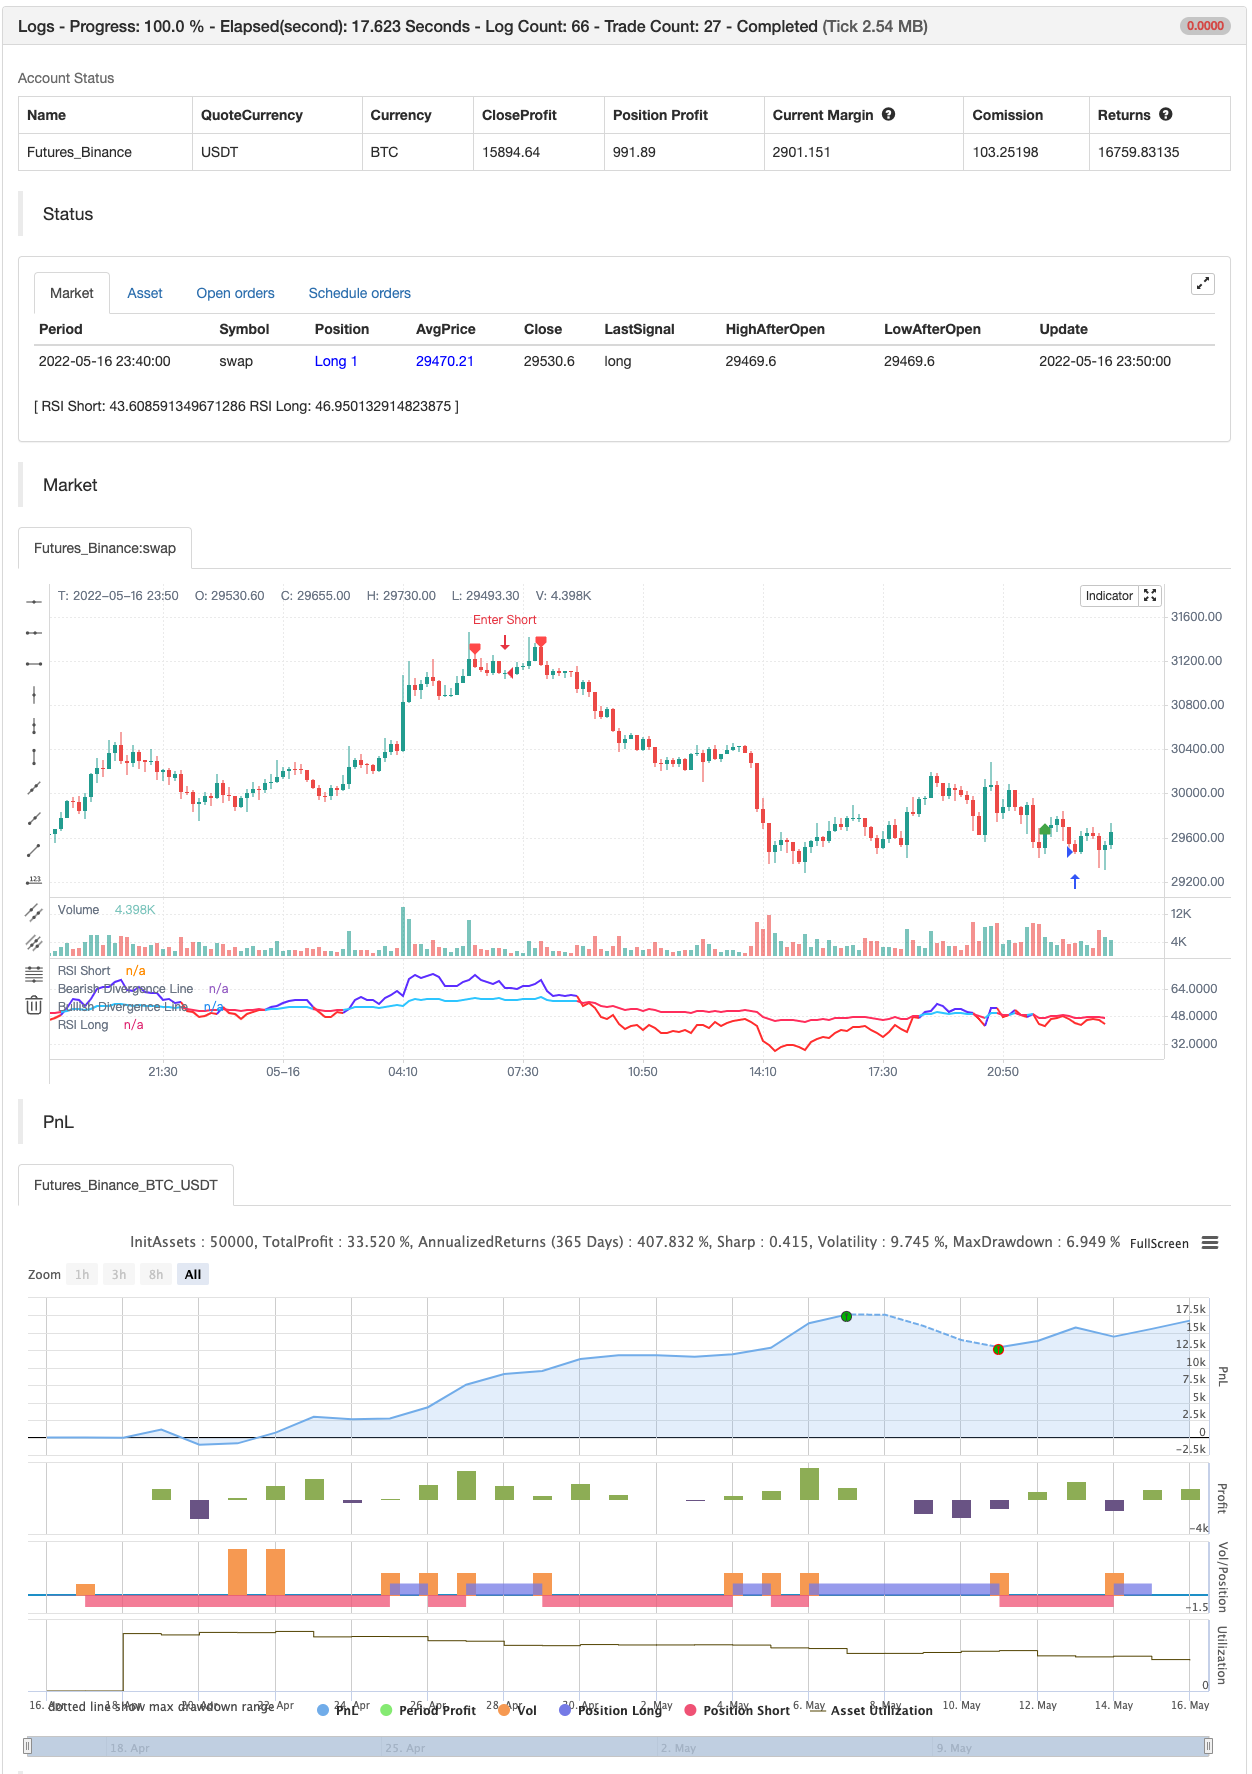
/*backtest
start: 2022-04-17 00:00:00
end: 2022-05-16 23:59:00
period: 10m
basePeriod: 1m
exchanges: [{"eid":"Futures_Binance","currency":"BTC_USDT"}]
*/

//@version=5
//Fukuiz
indicator(title='Fukuiz Trend', shorttitle='Fukuiz Trend', format=format.price, precision=2, timeframe='')

//color//
colorwhite = #FFFFFF
colorblue = #6633FF
colorred = #FF3333
colorblue2 = #33CCFF
colorpink = #FF3366

//Fuction//
len = input.int(24, minval=1, title='RSI Short')
len2 = input.int(100, minval=1, title='RSI Long')
src = input(open, 'Source')
up = ta.rma(math.max(ta.change(src), 0), len)
down = ta.rma(-math.min(ta.change(src), 0), len)
up2 = ta.rma(math.max(ta.change(src), 0), len2)
down2 = ta.rma(-math.min(ta.change(src), 0), len2)
rsi = down == 0 ? 100 : up == 0 ? 0 : 100 - 100 / (1 + up / down)
rsi2 = down2 == 0 ? 100 : up2 == 0 ? 0 : 100 - 100 / (1 + up2 / down2)

Bullish = rsi > rsi2
Bearish = rsi < rsi2
Fukuizcolor = Bullish ? color.new(colorblue,0) : Bearish ? color.new(colorred,0) : na
Fukuizcolor2 = Bullish ? color.new(colorblue2,0) : Bearish ? color.new(colorpink,0) : na
Fukuizcolor3 = Bullish ? color.new(colorblue,75) : Bearish ? color.new(colorred,75) : na

//Plot//
l1 = plot(rsi, 'RSI Short', color=Fukuizcolor, linewidth=2, style=plot.style_line)
l2 = plot(rsi2, 'RSI Long', color=Fukuizcolor2, linewidth=2, style=plot.style_line)
band2 = hline(50, 'Middle Band', color=#FFCC99)
band1 = hline(70, 'Upper Band', color=#FFCC99)
band0 = hline(30, 'Lower Band', color=#FFCC99)
fill(band1, band0, color.new(#0946CA, 90), title='Background')
fill(l1, l2, color=Fukuizcolor3, title='Trend Background')


//DIVERGENCE//
lbR = input(title='Pivot Lookback Right', defval=5)
lbL = input(title='Pivot Lookback Left', defval=5)
rangeUpper = input(title='Max of Lookback Range', defval=60)
rangeLower = input(title='Min of Lookback Range', defval=5)
plotBull = input(title='Bullish Divergence', defval=true)
plotBear = input(title='Bearish Divergence', defval=true)
bearColor = color.red
bullColor = color.green
hiddenBullColor = color.new(color.green, 80)
hiddenBearColor = color.new(color.red, 80)
textColor = color.white
noneColor = color.new(color.white, 100)
osc = ta.rsi(src, len)

plFound = na(ta.pivotlow(osc, lbL, lbR)) ? false : true
phFound = na(ta.pivothigh(osc, lbL, lbR)) ? false : true
_inRange(cond) =>
    bars = ta.barssince(cond == true)
    rangeLower <= bars and bars <= rangeUpper

oscHL = osc[lbR] > ta.valuewhen(plFound, osc[lbR], 1) and _inRange(plFound[1])
priceLL = low[lbR] < ta.valuewhen(plFound, low[lbR], 1)
bullCond = plotBull and priceLL and oscHL and plFound

plot(plFound ? osc[lbR] : na, offset=-lbR, title='Bullish Divergence Line', linewidth=2, color=bullCond ? bullColor : noneColor,display=display.none)

plotshape(bullCond ? osc[lbR] : na, offset=-lbR, title='Bullish Divergence Label', text=' Bull ', style=shape.labelup, location=location.absolute, color=color.new(bullColor, 0), textcolor=color.new(textColor, 0))

oscLH = osc[lbR] < ta.valuewhen(phFound, osc[lbR], 1) and _inRange(phFound[1])
priceHH = high[lbR] > ta.valuewhen(phFound, high[lbR], 1)
bearCond = plotBear and priceHH and oscLH and phFound

plot(phFound ? osc[lbR] : na, offset=-lbR, title='Bearish Divergence Line', linewidth=2, color=bearCond ? bearColor : noneColor,display=display.none)

plotshape(bearCond ? osc[lbR] : na, offset=-lbR, title='Bearish Divergence Label', text=' Bear ', style=shape.labeldown, location=location.absolute, color=color.new(bearColor, 0), textcolor=color.new(textColor, 0))


if bullCond
    strategy.entry("Enter Long", strategy.long)
else if bearCond
    strategy.entry("Enter Short", strategy.short)
관련
- 구매/판매로 EMA ADX RSI를 스칼핑
- 슈퍼 스칼퍼 - 5분 15분
- RSI - 구매 판매 신호
- RSI 통계적 오프팅 전략
- RSI 상대적 강도 지수 전략
- zdmre의 RSI
- RSI MTF Ob+Os
- TMA-레거시
- 슈퍼트렉스
- 볼링거 + RSI, 더블 전략 v1.1
더 많은
- CM MACD 사용자 지정 지표 - 여러 시간 프레임 - V2
- HODL 라인
- 2 이동 평균 색 방향 탐지
- Scalping PullBack 도구 R1
- 매수 전략은 AO+Stoch+RSI+ATR에 달려 있습니다.
- EMA 트렌드 클라우드
- RedK 부피 가속 방향 에너지 비율
- 돈치안 브레이크아웃
- 레드K 모멘텀 바
- 슈퍼 점프 턴 백 볼링거 밴드
- 조니의 BOT
- SSL 하이브리드
- 캔들리어 출구
- 리소토
- EMA 클라우드 내일 전략
- 피브 포인트 슈퍼트렌드
- 슈퍼트렌드+4이동
- 모멘텀 기반의 지그자그
- VuManChu 암호 B + 격차 전략
- 컨셉 듀얼 슈퍼 트렌드