부피 흐름 v3
저자:차오장, 날짜: 2022-05-23 14:40:50태그:EMADEMA
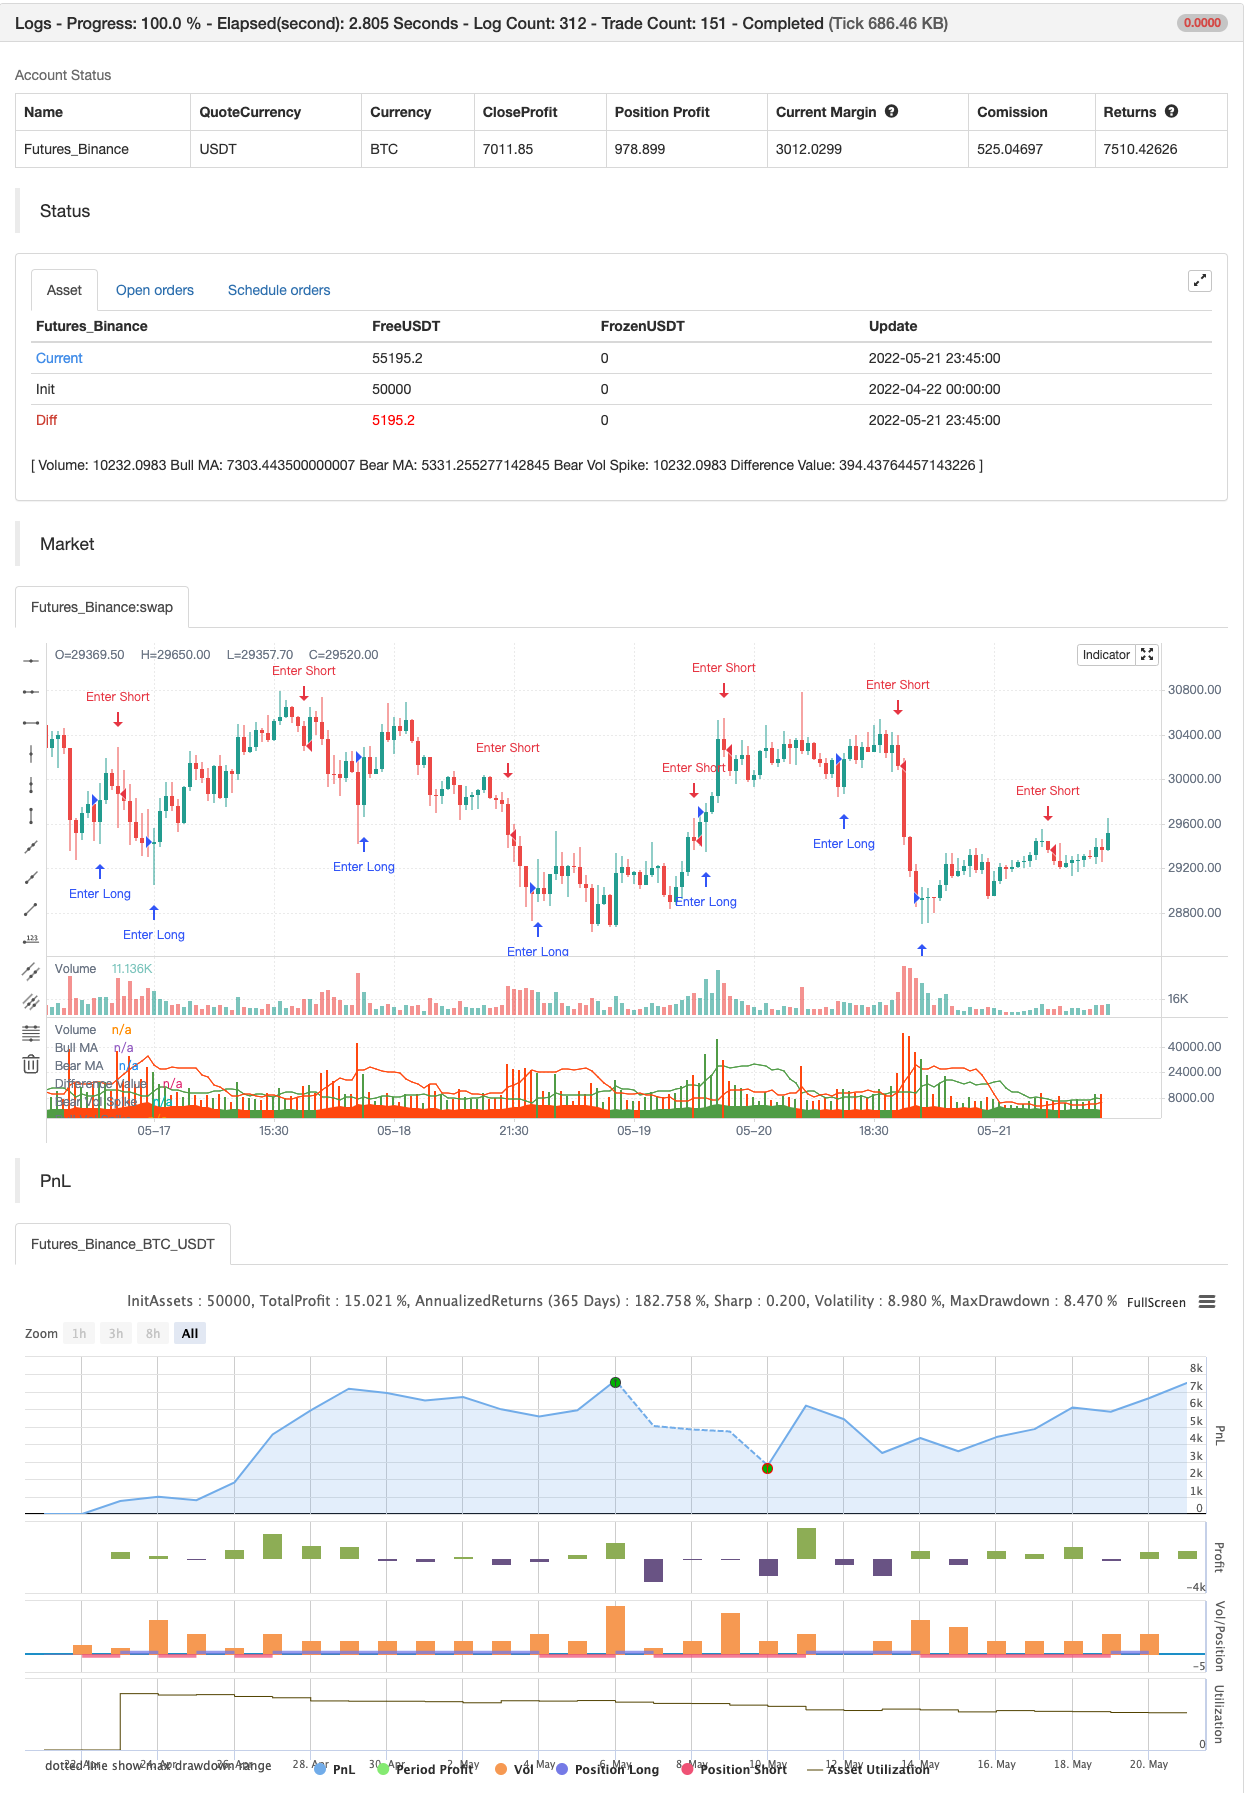
DepthHouse 볼륨 흐름 지표는 부정적 및 긍정적 인 볼륨 데이터를 엄격히 기반으로 트렌드 방향을 결정하는 데 도움이됩니다.
어떻게 읽을 수 있습니까?
- 이동평균의 크로스오버는 트렌드 변화 또는 리트레이싱의 가능성을 결정하는 데 사용됩니다.
- 아래쪽의 영역 구름은 이동 평균의 차이로 계산됩니다. 이것은 트렌딩 부피 강도를 결정하는 데 도움이 될 수 있습니다.
- 밝은 색의 볼륨 바는 옵션의 x 인자로 계산되는 큰 볼륨 스파이크입니다.
다른 변경 사항:
- DepthHouse는 많은 지표와 함께 오픈 소스로 바뀌고 있습니다.
- 부피는 이제 계산에 변경되지 않고 표시됩니다.
백테스트
/*backtest
start: 2022-04-22 00:00:00
end: 2022-05-21 23:59:00
period: 45m
basePeriod: 5m
exchanges: [{"eid":"Futures_Binance","currency":"BTC_USDT"}]
*/

//@version=4
//DepthHouse Trading Indicators
// by oh92
study("Volume Flow v3", shorttitle="Volume Flow [DepthHouse]")

maType =    input(title="Moving Average Type", options=["Simple", "Exponential", "Double Exponential"], defval="Simple")
length =    input(14, title="MA Length")
x      =    input(3.1, title="Factor For Breakout Candle")

//////////////////////////
// oh92 favorite colors //
//////////////////////////
red   = #FF510D      //#ff848a // #FA8072 // #323433 // #ff848a
green = #5AA650      // #8cffe5 // #6DC066 // #80aebd // #8cffe5

// Basic Volume Calcs //
vol  =  volume
bull =  close>open?vol:0
bear =  open>close?vol:0

// Double EMA Function //
dema(src, len) => (2 * ema(src, len) - ema(ema(src, len), len))

// BEAR Moving Average Calculation
bullma = maType == "Exponential" ?        ema(bull, length) :
         maType == "Double Exponential" ? dema(bull, length) :
         sma(bull, length)

// BEAR Moving Average Calculation //
bearma = maType == "Exponential" ?        ema(bear, length) :
         maType == "Double Exponential" ? dema(bear, length) :
         sma(bear, length)

// ma dif //
vf_dif = bullma-bearma
vf_absolute = vf_dif > 0 ? vf_dif : vf_dif * (-1)

// Volume Spikes //
gsig=crossover(bull, bullma*x)?vol:na
rsig=crossover(bear, bearma*x)?vol:na

// Color Calcs //
vdClr = vf_dif > 0 ? green : red
vClr=close>open?green:red

// Plots //
plot(vol, color=vClr, style=plot.style_columns, transp=80, title="Volume")
plot(bullma*2, color=green, linewidth=1, transp=0, title="Bull MA")
plot(bearma*2, color=red, linewidth=1, transp=0, title="Bear MA")

plot(gsig, style=plot.style_columns, transp=50, color=green, title="Bull Vol Spike")
plot(rsig, style=plot.style_columns, transp=50, color=red, title="Bear Vol Spike")

plot(vf_absolute/2.5, style=plot.style_area, color=vdClr, title="Difference Value")

if gsig
    strategy.entry("Enter Long", strategy.long)
else if rsig
    strategy.entry("Enter Short", strategy.short)
관련
- 슈퍼트렌드 이동 평균
- OCC 전략 R5.1
- 2 이동 평균 색 방향 탐지
- 이동 평균 색상 EMA/SMA
- 시드 보스
- CM 스링 샷 시스템
- 범주 필터 구매 및 판매 5분 [전략]
- 역동 망치 - 확장 옵션
- 스톡 슈퍼트르드 ATR 200ma
- 다중 시간 프레임 거래
더 많은
- 에너지 바와 함께 레드K 듀얼 바더
- 통합 구역 - 라이브
- 양적 질적 평가
- 이동 평균 크로스 알림, 다중 시간 프레임 (MTF)
- MACD 재충전 전략
- 슈퍼트렌드 이동 평균
- 거래 ABC
- 15MIN BTCUSDTPERP BOT
논 엔트로피 V2 - 수퍼트렌드 ATR TRAILING STOP LOSS
- ma & rsi - ogcheckers와 함께 암호화 선물 시간 스칼핑
- ATR 평평화
- 주문 블록 검색어
- 트렌드 스칼프-프랙탈박스-3EMA
- QQE 신호
- U비트 격자 팽창 필터링
- CM MACD 사용자 지정 지표 - 여러 시간 프레임 - V2
- HODL 라인
- 2 이동 평균 색 방향 탐지
- Scalping PullBack 도구 R1