72s: 적응형 헬스 이동 평균 +
저자:차오장, 날짜: 2022-05-26 17:17:37태그:HMAATR
초보 트레이더에게 어려운 문제 중 하나는 시장 조건을 구별하는 것입니다. 현재 시장이 가능한 한 빨리, 가능한 한 짧은 시간에 이익을 쌓을 수있는 가장 좋은 기회를 제공하는지 여부.
내일, 우리는 큰 은행의 일부 큰 행동을 보았는데 어느 정도 HMA 200에 의해 정의 될 수 있습니다. 나는 그것이 일어날 때 더 명확한 징후를 얻기 위해 가격 역학 (중심적인 움직임과 소소한 소음을 분리) 에 더 적합하도록 시각을 만드는 것을 생각하고 있습니다. 그래서 힘이 실제로 시작되는 것을 한눈에 볼 수 더 쉬울 것입니다. 덜 혼란스러운 차트.
이 적응형 HMA는 이제 여러 파이프 함수들에 대한 동적 길이 논리를 지원하는 새로운 파이프 스크립트 (Pine Script
적응 HMA 기간이 어떤 측면에 적응하는지 선택할 수 있습니다.
이 연구에서 나는 두 가지 옵션으로 제시합니다: 부피와 변동성. 그것은 현재 어떤 상황에 있는지에 따라 더 빨리 또는 더 느리게 움직입니다. 즉: 부피가 일반적으로 낮거나 변동성 판독이 없을 때 가격은 크게 움직이지 않을 것입니다. 따라서 적응하는 MA는 역동적으로 룩백 기간을 연장함으로써 느려질 것입니다. 그리고 그 반대의 경우.
어댑터에서 색상 표시는 위에서 설명한 상황과 비슷합니다. 또한, 나는 또한 트렌드 강도 또는 측면 / 헐렁한 조건을 측정하는 데 도움이되는 MA의 기울기 계산과 결합합니다.
이렇게 하면 동적 지원/항항으로 사용할 때 시각적으로 더 신뢰할 수 있습니다.
둘째, 그리고 더 중요한 것은, 그것은 우리에게 거래자가 더 나은 확률 정보를 얻을 수 있습니다. 즉: 중간 시간에 시장이 많은 움직임을 주지 않는다면, 모든 이익은 또한 그렇게 될 것입니다. 대부분의 경우, 우리는 나중에 돈을 저장하거나 다른 곳에 배치하는 것이 좋습니다.
사용 방법: 더 나은 동적 지원/저항 및 더 명확한 브레이크오웃 확인 외에도 MA는 다음과 같이 색상됩니다. 노란색: 시장은 통합 또는 평평합니다. 옆으로, 흔들림, 또는 비교적 작은 움직임. 트렌딩 시장에 나타나면 현재의 추세가 방향을 바꾸거나 다른 쪽으로 가격 돌파를 확인 할 수있는 초기 징후 일 수 있습니다. 밝은 녹색 또는 밝은 빨간색: 트렌드가 형성되고 있지만 여전히 상대적으로 약하거나 약해지고 있는지 알려줍니다. 왜냐하면 그것은 지원할 수 있는 부피나 변동성을 가지고 있지 않기 때문입니다. 어두운 녹색 또는 어두운 빨간색: 이 때 우리는 좋은, 강한 가격 움직임을 기대할 수 있습니다. 충분히 강력하다면, 많은 경우 새로운 장기적인 주요 트렌드의 시작을 나타냅니다.
설정: 충전기: HMA가 어떤 측면에 연결되어야 하는지 선택하세요. 최소 기간, 최대 기간: 172 - 233는 내일 HMA 200을 능가하기 위한 제 자신의 설정입니다. 나는 그것을 찾습니다. 내 스타일의 거래에서 거의 모든 쌍에서 15m tf에서 가장 좋고, 일부 주식에서 15m에서 1H에서 가장 좋습니다. 그것은 또한 기존 EMA 200과 잘 작동합니다. 때로는 가격이 어디로 가야하는지 정의하는 데 다소 손을 잡고 작동하는 것처럼. 그러나 당신은 물론 더 넓거나 좁은 다른 범위를 실험 할 수 있습니다. 특히 당신이 이미 따르기 위해 확립된 전략을 가지고 있다면: 통합 영역의 기준: 이것은 기울기 계산과 관련이 있습니다. 숫자가 커질수록 시장이 평평한 (노란) 영역에서 벗어나지 않도록 더 많은 MA가 필요하다는 것을 의미합니다. 필터를 가볍게 하거나 반대로 필요한 경우 유용 할 수 있습니다. 배경 색상: 시장 조건의 차이를 강조하기 위한 또 다른 색칠입니다.
경보: 두 개의 경보가 있습니다. 부피 분해: 부피가 평균 이상으로 분해될 때 변동성 측정기: 시장이 큰 흔들리는 붓의 순간을 가질 가능성이 높습니다.
사용 방법: 아주 아주 좋은 구매 항목 큰 상승 움직임을 잡기 위해:
- 가격은 MA 위에 있습니다. (가격 또한 MA에서 멀리 떨어져 있지 않을 때 가장 좋습니다, 또는 당신은 또한 도움을 멀리 오시레이터를 사용할 수 있습니다)
- HMA
의 색은 어두운 녹색입니다. 그것은 당신이 선택한 모양으로 충전 플러그에 있습니다. - RSI는 50 이상입니다. 이것은 추가 확인으로 도움이 됩니다.
명확한 SELL 입력 신호는 위와 동일합니다, 단지 반대입니다.
백테스트
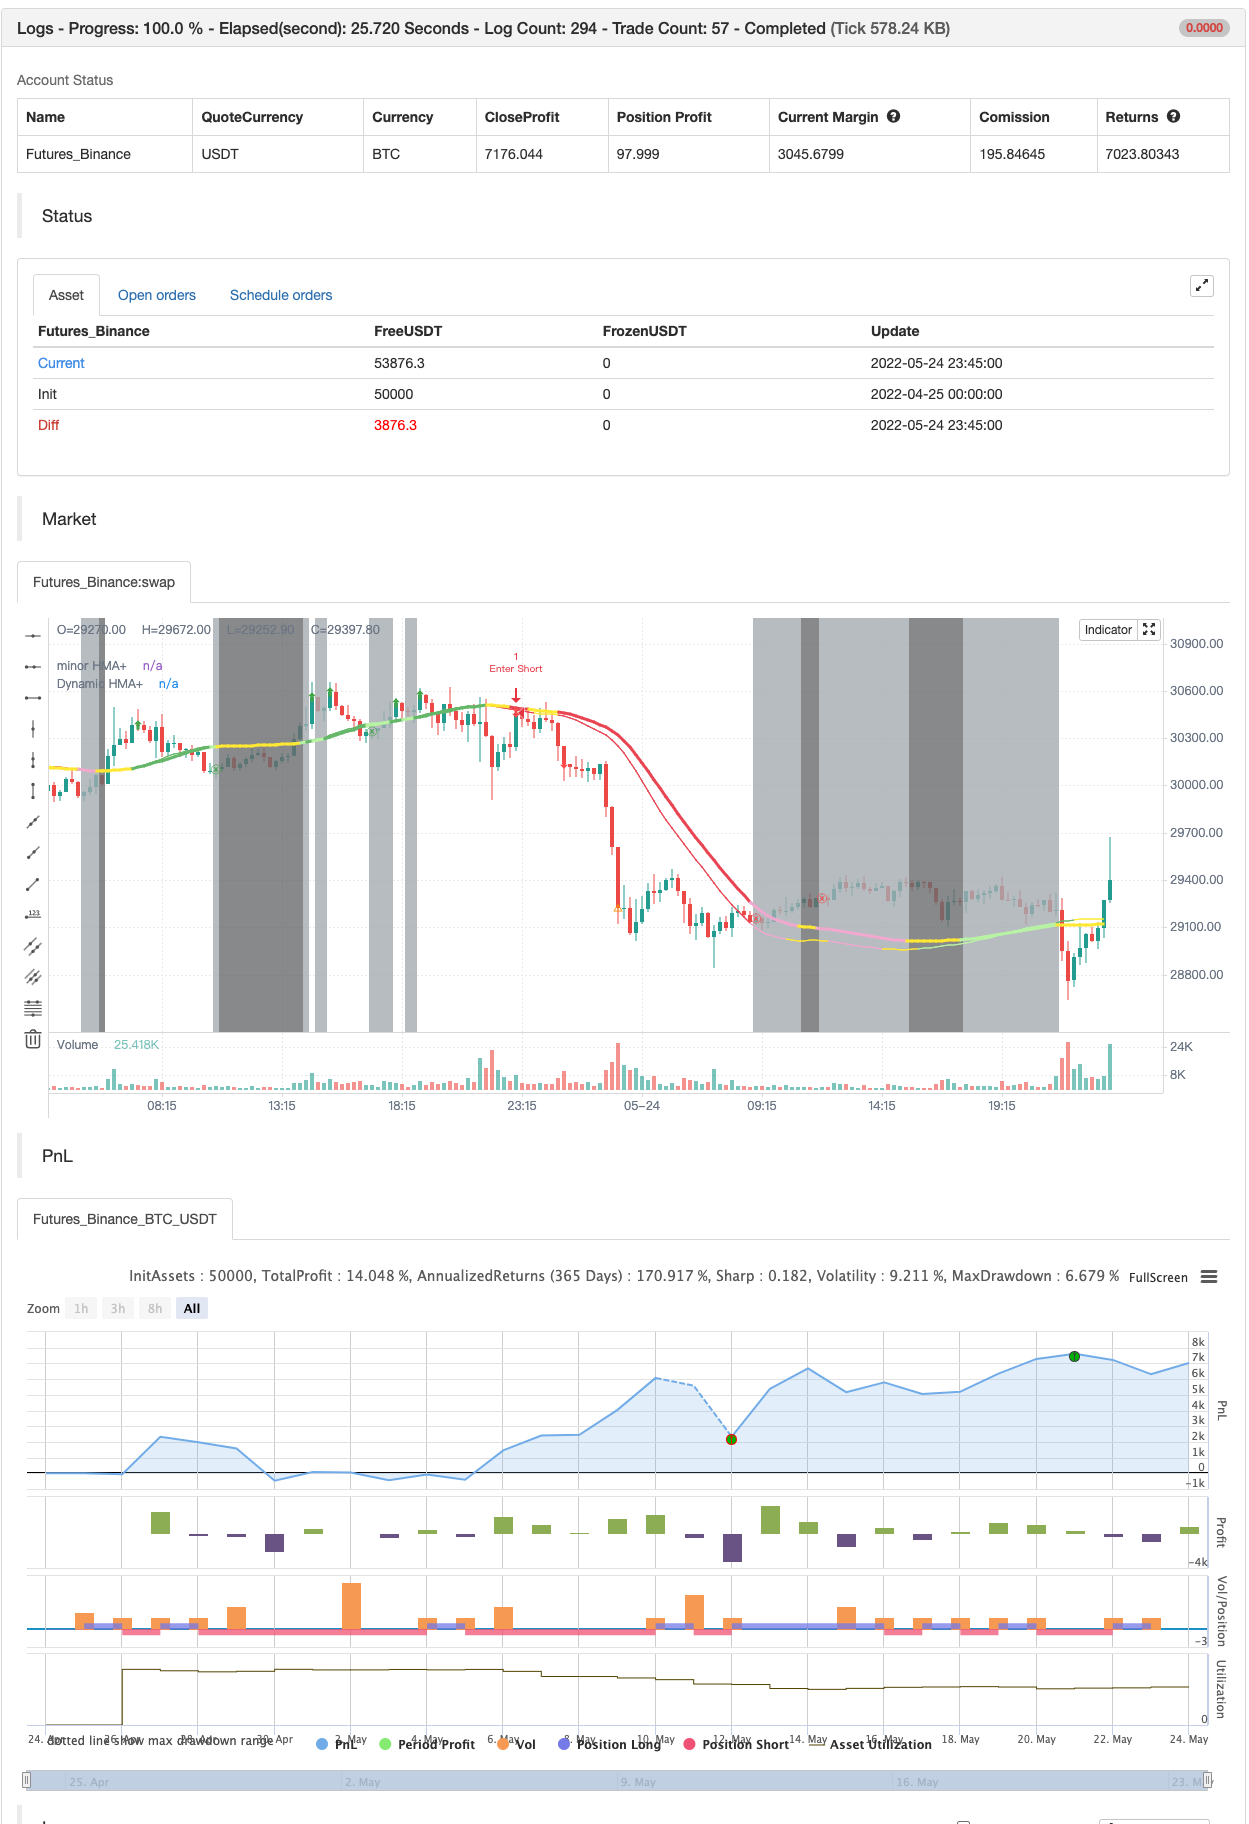
/*backtest
start: 2022-04-25 00:00:00
end: 2022-05-24 23:59:00
period: 15m
basePeriod: 5m
exchanges: [{"eid":"Futures_Binance","currency":"BTC_USDT"}]
*/

// This source code is subject to the terms of the Mozilla Public License 2.0 at https://mozilla.org/MPL/2.0/
// 2020 © io72signals / Antorio Bergasdito

//@version=4
study("72s: Adaptive Hull Moving Average+", shorttitle="72s: Adaptive HMA+", overlay=true)

//Optional Inputs
charger     = input("Volatility", title="Choose which charger to adapt to:", options=["Volatility", "Volume"])
src         = input(close, title="Source:")
minLength   = input(172, title="Minimum period:")
maxLength   = input(233, title="Maximum period:")
adaptPct    = 0.03141 //input(3.141, minval = 0, maxval = 100, title="Adapting Percentage:") / 100.0

flat        = input(17, title="Consolidation area is when slope below:")

showMinor   = input(true, title="Show minor xHMA+", group="Minor Adaptive HMA+ Period")
minorMin    = input(89, title="Minimum:", group="Minor Adaptive HMA+ Period", inline="mHMA+")
minorMax    = input(121, title="Maximum:", group="Minor Adaptive HMA+ Period", inline="mHMA+")

showZone    = input(false, title="Show Adaptive HMA+ Distance Zone", group="DISTANCE ZONE")
mult        = input(2.7, title="Distance (Envelope) Multiplier", step=.1, group="DISTANCE ZONE")

showSignals = input(true, title="Show Possible Signals", group="OTHER")
useBg       = input(true, title="Background color to differentiate movement", group="OTHER")

//Source to adapt to
highVolatility = atr(14) > atr(46)                  //Volatility Meter. Change it to match to your strat/pair/tf if needs.

rsivol  = rsi(volume,14)                            //RSI Volume Osc:
osc     = hma(rsivol,10)                            //Basically it's almost the same as: vol > ma(volume,20)
volBreak = osc > 49                                 //but smoothed using weight to filter noise or catch earlier signs.

//Dynamics
var float dynamicLength = avg(minLength,maxLength)
var float minorLength   = avg(minorMin,minorMax)
plugged = charger=="Volume"? volBreak : highVolatility
dynamicLength   := iff(plugged, max(minLength, dynamicLength * (1 - adaptPct)), min(maxLength, dynamicLength * (1 + adaptPct)))
minorLength     := iff(plugged, max(minorMin, minorLength * (1 - adaptPct)), min(minorMax, minorLength * (1 + adaptPct)))

//Slope calculation to determine whether market is in trend, or in consolidation or choppy, or might about to change current trend
slope_period = 34, range = 25, pi = atan(1) * 4
highestHigh = highest(slope_period), lowestLow = lowest(slope_period)
slope_range = range / (highestHigh - lowestLow) * lowestLow
calcslope(_ma)=>
    dt = (_ma[2] - _ma) / src * slope_range
    c = sqrt(1 + dt * dt)
    xAngle = round(180 * acos(1 / c) / pi)
    maAngle = iff(dt > 0, -xAngle, xAngle)
    maAngle

//MA coloring to mark market dynamics
dynColor(_ma,_col1a,_col1b, _col2a, _col2b, _col0) =>
    slope = calcslope(_ma)
    slope >= flat ? plugged? _col1a : _col1b :
     slope < flat and slope > -flat ? _col0 :
     slope <= -flat ? plugged? _col2a : _col2b : _col0

//Adaptive HMA
xhma(_src,_length) => _return = wma(2 * wma(_src, _length / 2) - wma(_src, _length), floor(sqrt(_length)))

dynamicHMA  = xhma(src,int(dynamicLength))      //<--Batman - Our main xHMA+
minorHMA    = xhma(src,int(minorLength))        //<--Robin  - Faster minor xHMA+ (Optional). Can be use to assist for
                                                //            faster entry, slower exit point, or pullbacks info too.

//Plot
plot(dynamicHMA, "Dynamic HMA+", dynColor(dynamicHMA, #6fbf73, #c0f5ae, #eb4d5c, #f2b1d4, color.yellow), 3)
plot(showMinor? minorHMA:na, "minor HMA+", dynColor(minorHMA, #6fbf73, #c0f5ae, #eb4d5c, #f2b1d4, color.yellow), 1)

//Backgroud coloring
notgreat = calcslope(dynamicHMA) < flat and calcslope(dynamicHMA) > -flat
bgcolor(useBg? plugged? na : notgreat? #757779: #afb4b9 : na)

// Comparative study
// staticHMA = hma(close, 200)
// plot(staticHMA,  "Static HMA")
// plotchar(dynamicLength, "dynamicLengthgth", "", location.top) //check output the calculated Dynamic Length in the Data Window.

//{ DISTANCE ZONE
// Envelope the main DynamicHMA with ATR band, just one way to approximate current price distance to MA. Other usages/methods may vary.
upperTL = dynamicHMA + mult * atr(40)        ,  lowerTL = dynamicHMA - mult * atr(40)           //<--Half distance zone
topTL = dynamicHMA + (mult*2) * atr(40)      ,  botTL = dynamicHMA - (mult*2) * atr(40)         //<--One distance zone
stopupperTL = dynamicHMA + (mult/2) * atr(40),  stoplowerTL = dynamicHMA - (mult/2) * atr(40)   //<--Half of the half. If need ie. tighter SL or trailing

// Plotting Distance Zone
plot(showZone?upperTL:na, color=color.green, transp=72)
plot(showZone?lowerTL:na, color=color.red,   transp=72)
plot(showZone?topTL:na, color=color.gray, transp=72)
plot(showZone?botTL:na, color=color.gray, transp=72)
sutl = plot(showZone?stopupperTL:na, color=color.white, transp=100)
sltl = plot(showZone?stoplowerTL:na, color=color.white, transp=100)
colZone = showZone? color.purple:color.new(color.white,100)
fill(sutl, sltl, color=colZone, transp=90)
//}

//{ SIGNALS
_slope = calcslope(dynamicHMA)

// Entry Base; When HMA+ turn to a darker color and market is out from low volatility.
// Remember to also considering price distance to MA and strength (ie. RSI)
_upSig = _slope >=  flat and plugged
_dnSig = _slope <= -flat and plugged
buy  = _upSig and not _upSig[1]
sell = _dnSig and not _dnSig[1]

// Possible Exits. These only based on faster xHMA+
_upExit = _slope>=flat  and (not plugged) and close<minorHMA
_dnExit = _slope<=-flat and (not plugged) and close>minorHMA
fastExits  = (_upExit and not _upExit[1]) or (_dnExit and not _dnExit[1])

// Caution Sign. When Price crossed most outer distance zone. Could also be a good TP spot if your already in profit
_topWarn    = high>topTL
_botWarn    = low<botTL
warningSigns = (_topWarn and not _topWarn[1]) or (_botWarn and not _botWarn[1])

// Plot 'em up
atrPos = 0.72 * atr(5)
plotchar(showSignals and buy?  dynamicHMA-atrPos: na, color=color.green, location=location.absolute, char="⬆", size = size.tiny)
plotchar(showSignals and sell? dynamicHMA+atrPos: na, color=color.red,   location=location.absolute, char="⬇", size = size.tiny)
plotchar(showSignals and fastExits? _upExit? minorHMA+atrPos: _dnExit? minorHMA-atrPos: na: na,
     color=_upExit?color.green:_dnExit?color.red: na, location=location.absolute, char="ⓧ", size=size.tiny)
plotchar(showSignals and warningSigns? _topWarn? high+atrPos: _botWarn? low-atrPos: na: na,
     color=color.orange, location=location.absolute, char="⚠", size=size.tiny)
//}

//{ ALERTS
// Previous alerts:
// alertcondition(highVolatility and not notgreat, "72s: Volatility Meter", "Market is on the move")
// alertcondition(volBreak[1] and volBreak and not notgreat, "72s: Volume Break", "Volume has just break above average")

// New Alert:
// Delete what alert you don't need:
if buy
    alert("Possible Buy Signal at" + tostring(close), alert.freq_once_per_bar_close)
if sell
    alert("Possible Sell Signal at" + tostring(close), alert.freq_once_per_bar_close)

if fastExits and _upExit
    alert("Price has just crossed down minor xHMA+ at" + tostring(close), alert.freq_once_per_bar_close)
if fastExits and _dnExit
    alert("Price has just crossed up minor xHMA+ at" + tostring(close), alert.freq_once_per_bar_close)

if warningSigns and _topWarn
    alert("Price has just crossed above top xHMA+ zone", alert.freq_once_per_bar_close)
if warningSigns and _botWarn
    alert("Price has just crossed below bottom xHMA+ zone", alert.freq_once_per_bar_close)
//}


if buy
    strategy.entry("Enter Long", strategy.long)
else if sell
    strategy.entry("Enter Short", strategy.short)
- 부피 MA 기반의 적응형 피라미딩 동적 스톱 로스 및 취득 거래 전략
- 밀레 머신
- HODL 라인
- 다곡물 바게트
- 파업 을 가진 피보나치 순서
- 알파 트렌드 사용
- 캔들리어 출구
- 수퍼트렌드 ATR TRAILING STOP LOSS
- 알파 트렌드
- RSI 트렌드 역전 전략