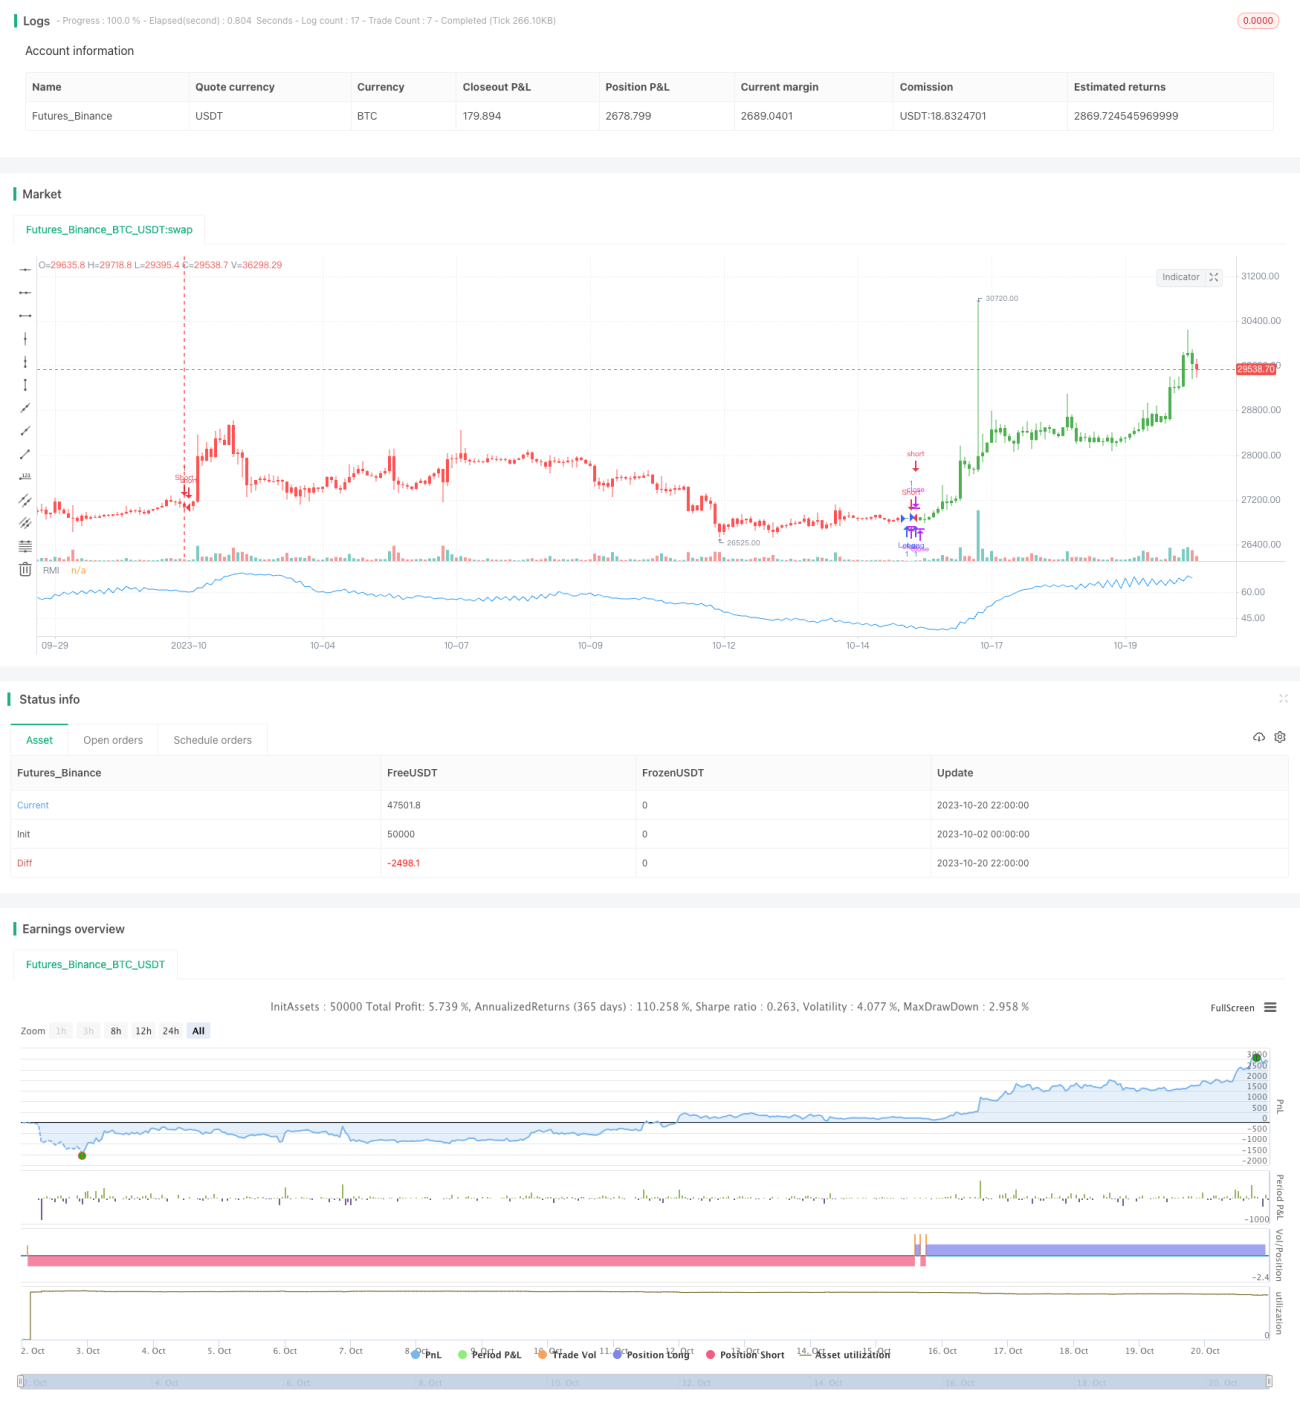
모멘텀 반전 지수 전략

1
Follow
1778
Followers
개요
역동량 인덱스 (Relative Momentum Index, RMI) 전략은 역동량 인덱스를 기반으로 한 개선 전략이다. 이 전략은 일정 기간 동안 가격 변화의 역량을 계산하여 시장이 과매매 또는 과매매 상태에 있는지 판단하여 역동 기회를 잡는다.
전략 원칙
RMI 전략의 계산 공식은 다음과 같습니다:
javascript
xMom = xPrice - xPrice[Length] //计算Length周期内的价格变动
xMU = 如果xMom >= 0:之前xMU减去xMU/Length加上xMom;否则:之前xMU
xMD = 如果xMom <= 0:之前xMD减去xMD/Length加上xMom的绝对值;否则:0
RM = xMU / xMD
RMI = 100 * (RM / (1 + RM))
이 전략은 먼저 Length 주기의 가격 변화를 xMom로 계산한다. xMom> = 0이면 가격이 상승하면, xMU는 xMom을 더한다. xMom < 0이면 가격이 떨어지면, xMD는 xMom의 절대값을 더한다.
RMI가 저가치 SellZone보다 높을 때, 과매입을 의미하며, 상장한다. RMI가 저가치 BuyZone보다 낮을 때, 과매매를 의미하며, 더 많이 한다.
전략적 이점
- RMI 지수는 RSI 지수보다 더 민감하며, 가격 반전의 기회를 더 빨리 잡을 수 있다.
- RMI는 폭락의 강도를 측정하고, 흔들림의 영향을 받지 않는다.
- RMI는 동력에 기반하여 과매매 상황을 더 정확하게 판단할 수 있다.
전략적 위험
- 다른 역전 전략과 마찬가지로 RMI 전략은 중도화될 위험이 있습니다.
- RMI 매개 변수는 다양한 품종에 대해 최적화해야 합니다. 그렇지 않으면 효과가 좋지 않을 수 있습니다.
- 오버 바이 오버 세일치 (OBS) 를 합리적으로 설정해야 합니다. 그렇지 않으면 너무 많은 가짜 신호가 생성됩니다.
적절히 느슨한 스톱포인트, 최적화된 변수 조합, 트렌드 전략 조합 등의 방법으로 위험을 줄일 수 있다.
전략 최적화
RMI 전략은 다음과 같은 측면에서 최적화될 수 있습니다.
- 길이를 최적화하여 전략 수익을 극대화 할 수 있는 주기 길이를 선택하십시오.
- 오버 바이 오버 세일 경계를 최적화하여 가짜 신호의 가능성을 낮추십시오.
- 단독 손실을 통제하기 위한 손해 방지 제도를 강화한다.
- 트렌드 추적이나 일률적 전략과 결합하면 승률이 높아집니다.
- 다양한 품종의 특성에 따라 적절한 거래 시기를 선택하여 전략의 안정성을 높인다.
요약하다
RMI 전략은 가격 동력의 변화를 측정하여 반전 작업을 수행하여 짧은 선 회귀 기회를 효과적으로 포착 할 수 있습니다. RMI 전략은 RSI 전략에 비해 더 민감하고 충격에 영향을받지 않습니다. 그러나이 전략은 여전히 조정이 될 위험이 있으며, 변수를 최적화하고 트렌드 전략과 함께 사용해야 최대 효과를 얻을 수 있습니다.
Source
Pine
/*backtest
start: 2023-10-02 00:00:00
end: 2023-10-21 00:00:00
period: 2h
basePeriod: 15m
exchanges: [{"eid":"Futures_Binance","currency":"BTC_USDT"}]
*/

//@version=2
////////////////////////////////////////////////////////////
//  Copyright by HPotter v1.0 19/10/2017
// The Relative Momentum Index (RMI) was developed by Roger Altman. Impressed Strategy parameters
Related strategies
Comment
All comments (0)
No data
- 1