개요
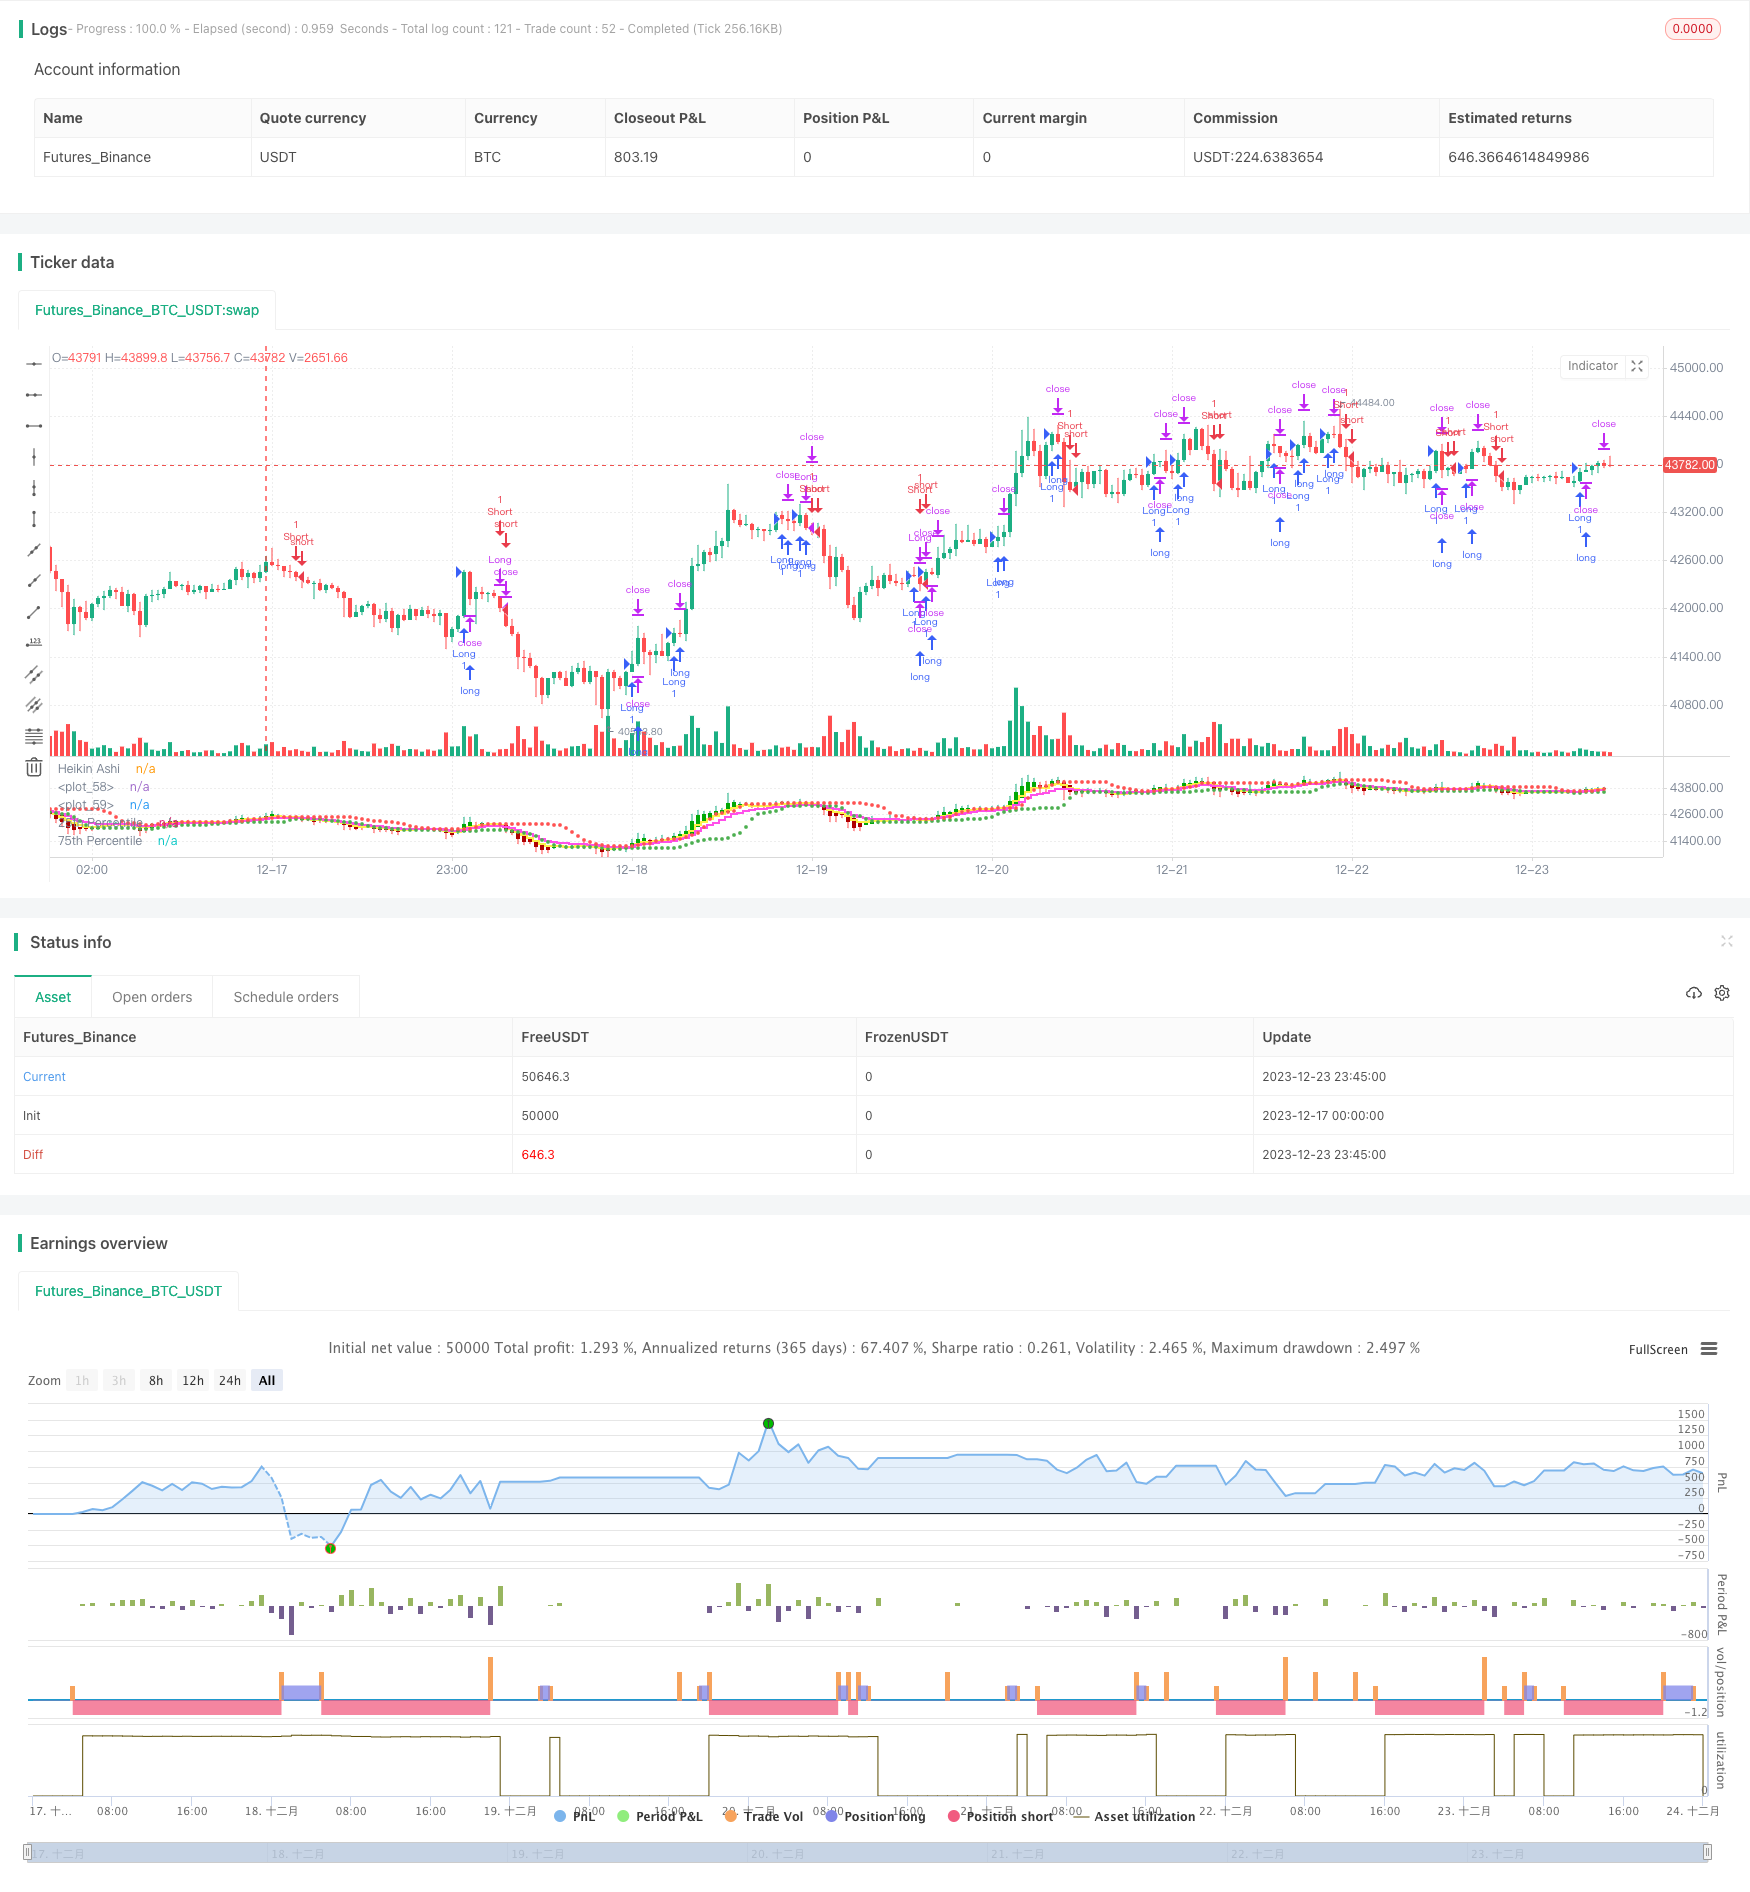
이 전략은 하인 아쉬 평균에서 거래 신호를 생성하는 것을 기반으로 한다. 이 중, 구매 및 판매 신호의 생성 하인 아쉬 종결 가격과 75 퍼센트 가격 수준의 교차와 하인 아쉬 종결 가격의 이동 평균보다 높은 두 가지 요소를 고려한다.
전략 원칙
이 전략은 하인 아쉬 평균을 사용하여 일반 K 선을 대신하여 분석합니다. 이 평균은 시장 소음을 필터링하여 추세와 역전 신호를 발견하는 데 도움이 됩니다. 구체적으로, 이 전략은 퍼센트 채널과 이동 평균을 결합하여 거래 신호를 생성합니다.
- 하인 아쉬의 종결가격이 75%를 넘었을 때 구매 신호가 발생한다.
- 하인 아쉬는 5일 이동 평균을 통과했을 때 매매 신호를 냅니다.
또한, 이 전략은 단방위험을 통제하기 위해 손해배상거리를 설정하고 손해배상 추적을 한다.
전략적 이점
- 하이엔 아쉬 평균선을 사용하면 트렌드를 더 명확하게 식별할 수 있으며, 반전 신호를 제때 발견할 수 있다.
- 백분율 채널과 결합하여, 가격이 열한 상태인지 또는 초상가 상태인지 판단하여 구매와 판매의 시간을 판단할 수 있다.
- 스톱로스를 설정하고 스톱로스를 추적하는 것은 위험을 적극적으로 통제하고, 감당할 수 있는 손실을 피하는 데 도움이 됩니다.
전략적 위험
- 하인 아쉬 평행선 자체는 지연을 발생시키며, 단선 조작의 최적의 지점을 놓칠 수 있다.
- 백분율 채널은 가격의 전환점을 완전히 결정할 수 없으며, 특정 가짜 신호 비율이 존재한다.
- 스탠드 거리 설정이 잘못되면 너무 느슨하거나 너무 꽉 잡혀서 전략의 성능에 영향을 미칠 수 있습니다.
위와 같은 위험을 줄이기 위해 이동 평균 주기를 적절하게 조정하거나 스톱 스포트 비율을 조정할 수 있습니다.
전략 최적화
- 다양한 이동 평균 조합을 테스트하여 최적의 변수를 찾아보세요.
- 다양한 퍼센티지 채널 파라미터를 테스트하여 가격의 한 영역 을 캡처하는 것을 보장합니다.
- 다른 지표와 결합하여 구매 신호를 검증하고, 가짜 신호를 필터링한다.
- 동적으로 스톱데일리지를 조정한다.
요약하다
이 전략은 하인 아쉬 평균, 퍼센티지얼 채널 및 이동 평균의 여러 지표를 통합하여 거래 시스템을 형성한다. 이 시스템은 트렌드 방향을 효과적으로 식별하고 위험을 제어하기 위해 스톱로스를 설정할 수 있으며, 고려할 가치가 있는 양적 거래 전략이다. 파라미터를 최적화하고 다른 보조 지표를 추가함으로써 시스템의 안정성을 더욱 향상시킬 수 있다.
전략 소스 코드
/*backtest
start: 2023-12-17 00:00:00
end: 2023-12-24 00:00:00
period: 45m
basePeriod: 5m
exchanges: [{"eid":"Futures_Binance","currency":"BTC_USDT"}]
*/

//@version=5
strategy("HK Percentile Interpolation One",shorttitle = "HKPIO", overlay=false, default_qty_type = strategy.cash, default_qty_value = 5000, calc_on_order_fills = true, calc_on_every_tick = true)

// Input parameters
stopLossPercentage = input(3, title="Stop Loss (%)") // User can set Stop Loss as a percentage
trailStopPercentage = input(1.5, title="Trailing Stop (%)") // User can set Trailing Stop as a percentage
lookback = input.int(14, title="Lookback Period", minval=1) // User can set the lookback period for percentile calculation
yellowLine_length = input.int(5, "Yellow", minval=1) // User can set the length for Yellow EMA
purplLine_length = input.int(10, "Purple", minval=1) // User can set the length for Purple EMA
holdPeriod = input.int(200, title="Minimum Holding Period", minval=10) // User can set the minimum holding period
startDate = timestamp("2021 01 01")  // User can set the start date for the strategy

// Calculate Heikin Ashi values
haClose = ohlc4
var float haOpen = na
haOpen := na(haOpen[1]) ? (open + close) / 2 : (haOpen[1] + haClose[1]) / 2
haHigh = math.max(nz(haOpen, high), nz(haClose, high), high)
haLow = math.min(nz(haOpen, low), nz(haClose, low), low)

// Calculate Moving Averages
yellowLine = ta.ema(haClose, yellowLine_length)
purplLine = ta.ema(haClose, purplLine_length)

// Calculate 25th and 75th percentiles
p25 = ta.percentile_linear_interpolation(haClose, lookback, 28)
p75 = ta.percentile_linear_interpolation(haClose, lookback, 78)

// Generate buy/sell signals
longSignal = ta.crossover(haClose, p75) and haClose > yellowLine
sellSignal = ta.crossunder(haClose, yellowLine)
longSignal1 = ta.crossover(haClose, p75) and haClose > purplLine
sellSignal1 = ta.crossunder(haClose, purplLine)

// Set start time and trade conditions
if(time >= startDate)
    // When longSignal is true, enter a long trade and set stop loss and trailing stop conditions
    if (longSignal)
        strategy.entry("Long", strategy.long, 1)
        strategy.exit("Sell", "Long", stop=close*(1-stopLossPercentage/100), trail_points=close*trailStopPercentage/100, trail_offset=close*trailStopPercentage/100)
    // When sellSignal is true, close the long trade
    if (sellSignal)
        strategy.close("Long")
    // When sellSignal1 is true, enter a short trade
    if (sellSignal1)
        strategy.entry("Short", strategy.short, 1)
    // When longSignal1 is true, close the short trade
    if (longSignal1)
        strategy.close("Short")

// Plot Heikin Ashi candles
plotcandle(haOpen, haHigh, haLow, haClose, title="Heikin Ashi", color=(haClose >= haOpen ? color.rgb(1, 168, 6) : color.rgb(176, 0, 0)))

// Plot 25th and 75th percentile levels
plot(p25, title="25th Percentile", color=color.green, linewidth=1, style=plot.style_circles)
plot(p75, title="75th Percentile", color=color.red, linewidth=1, style=plot.style_circles)

// Plot Moving Averages
plot(yellowLine, color = color.rgb(254, 242, 73, 2), linewidth = 2, style = plot.style_stepline)
plot(purplLine, color = color.rgb(255, 77, 234, 2), linewidth = 2, style = plot.style_stepline)