개요
이 전략은 트리플 지수 이동 평균 지표와 무작위 지수 평면 이동 평균 지표를 결합하여 거래 신호를 생성하는 트렌드 추적 전략이다. 빠른 이동 평균 상에서 빠른 이동 평균을 통과하면, 빠른 이동 평균 상에서 느린 이동 평균을 통과하면 더 많이 보며, 빠른 이동 평균 아래에서 빠른 이동 평균을 통과하면, 느린 이동 평균을 통과하면 더 많은 것을 본다. 이 전략은 무작위 지수 평면 이동 평균 지표를 보조 판단 지표로 도입하기도 한다.
원칙
8일, 14일, 50일 트리플 지수 이동 평균을 사용한다. 14일 지수 이동 평균을 8일 지수 이동 평균에 가로질러 14일 지수 이동 평균을 50일 지수 이동 평균에 가로질러 가로질러 볼 수 있는 신호가 발생한다. 반대로, 볼 수 없는 신호이다.
무작위 지수 평평한 이동 평균 지표 ((Stochastic RSI) 를 보조 판단 지표로 사용한다. 구체적으로: 먼저 14 일 RSI를 계산하고, 그 다음 RSI 지표의 기초에 Stochastic 지표를 계산하고, 마지막으로 3 일 간단한 이동 평균을 계산한 K 선과 3 일 간단한 이동 평균을 계산한 D 선을 얻는다. K 선이 D 선을 통과할 때, 더 많은 보기의 보조 신호로.
거래 신호를 생성할 때, 가격이 8일 지수 이동 평균보다 높으면 더 많이 입금하고, 가격이 8일 지수 이동 평균보다 낮으면 공백을 입금한다.
정지는 입시 가격 아래/ 위 1배의 ATR 거리에 위치한다. 정지는 입시 가격 위/ 아래 4배의 ATR 거리에 위치한다.
장점
이동 평균은 기본 지표로서 시장 추세를 효과적으로 추적할 수 있다. 트리플 지수 이동 평균은 조합하여 여러 주기를 사용함으로써 단기 및 중장기 추세에 대한 민감성을 동시에 보장할 수 있다.
스토카스틱 RSI를 추가하여 잘못된 신호를 필터링하여 진입의 정확성을 향상시킬 수 있습니다.
ATR에 따라 스톱포드 위치를 설정하여 시장의 변동 정도를 동적으로 추적할 수 있으며, 스톱포드가 너무 크거나 너무 작지 않도록 한다.
이 전략의 매개 변수 설정은 합리적이며, 큰 트렌드 아래에서 우수한 성능을 보여준다. 회귀가 작고, 수익은 평평하며, 긴 선 운영에 적합하다.
위험
다중 지표 조합 전략은 반전 위험을 증가시킵니다. 이동 평균과 스토카스틱 RSI가 반대 신호를 발산할 때 거래 신호 오류가 발생할 수 있습니다. 이 경우 가격 자체의 경향성에 주의를 기울여야 합니다.
스톱 및 스톱의 설정은 비교적 보수적이며, 시장상태가 급격하게 변동할 때 돌파되어 스톱될 수 있으며, 트렌드 기회를 놓치게 된다. 이 때 ATR 파라미터를 적절히 조정하거나 스톱 스톱의 배수를 확대할 수 있다.
트리플 이동 평균이 사용됨에 따라, 빠른 선과 중속 선이 반전될 때, 약간의 지연이 있을 것이다. 이 때는 가격이 스스로 반전되는지 여부에 주목하여 진입 여부를 결정해야 한다.
이 전략은 주로 트렌디스틱한 행태에 적합하며, 평준화 시에는 좋지 않다. 이 경우 이동 평균의 주기적 매개 변수를 최적화하거나 다른 판단 지표를 사용할 수 있다.
최적화
진출 시기를 더욱 최적화하기 위해 MACD와 같은 다른 지표를 추가하는 것을 고려할 수 있습니다. 또한 다른 파라미터의 이동 평균 조합을 테스트 할 수 있습니다.
ATR 공중 검사의 파라미터를 최적화할 수 있다. 예를 들어, 1ATR에서 1.5ATR로 정지를 조정하고, 4ATR에서 3ATR로 정지를 조정하여 더 나은 수익을 얻을 수 있는지 확인한다.
이동 평균만 사용해서 스토카스틱 RSI를 제거하여 더 많은 잡음을 필터링하여 더 안정적인 수익을 얻을 수 있는지 테스트 할 수 있습니다.
트렌드를 판단하기 위해 더 많은 조건을 추가하는 것을 고려할 수 있습니다. 예를 들어, 거래량 지표를 추가하여 큰 수준의 트렌드에서 작동하는 것을 보장합니다.
요약하다
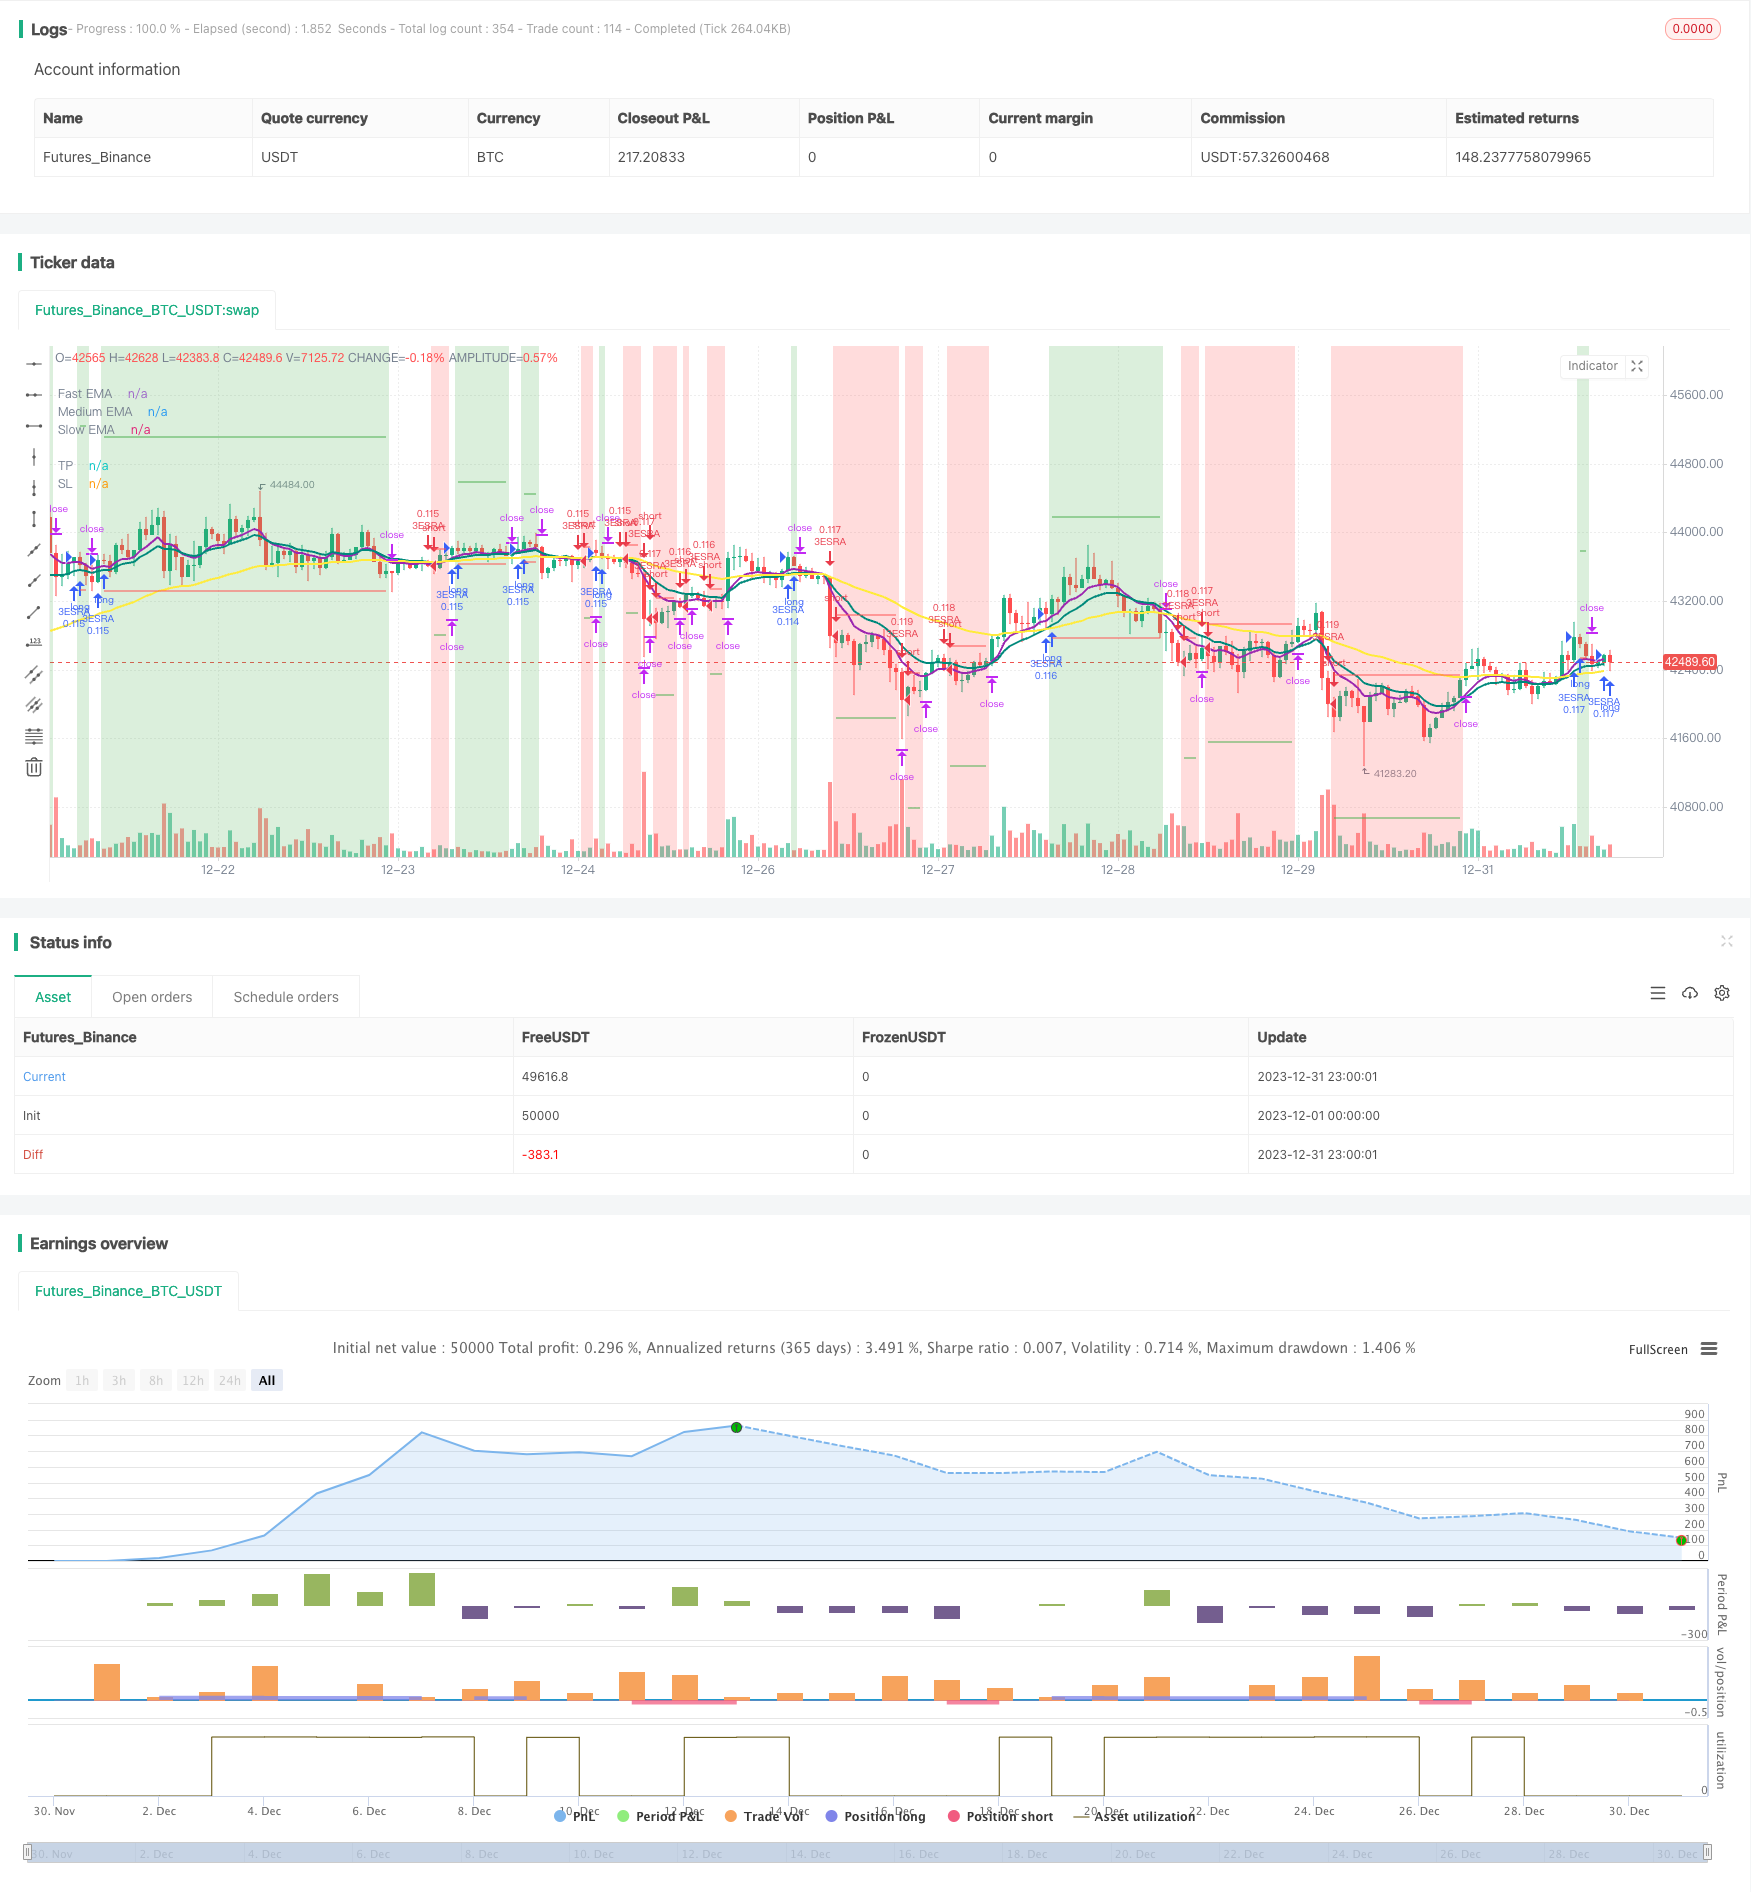
이 전략은 트리플 지수 이동 평균과 Stochastic RSI 지표를 통합하여 트렌드 방향을 결정한다. 입문 신호는 엄격하며, 무관한 거래를 효과적으로 줄일 수 있다. 스톱 스톱 손실 설정은 ATR을 동적으로 추적하여 전략 파라미터를 자율적으로 조정한다. 역검사 결과에 따르면, 이 전략은 트렌드 상황에서 우수한 성능을 발휘하고, 회전이 작고, 수익은 평평하다.
/*backtest
start: 2023-12-01 00:00:00
end: 2023-12-31 23:59:59
period: 1h
basePeriod: 15m
exchanges: [{"eid":"Futures_Binance","currency":"BTC_USDT"}]
*/

//              3ESRA
//              v0.2a

// Coded by Vaida Bogdan

// 3ESRA consists of a 3 EMA cross + a close above (for longs) the quickest EMA
// or below (for shorts). Note that I've deactivated the RSI Cross Over/Under
// (you can modify the code and activate it). The strategy also uses a stop loss
// that's at 1 ATR distance from the entry price and a take profit that's at
// 4 times the ATR distance from the entry price.

// Feedback:
// Tested BTCUSDT Daily
// 1. Stoch-RSI makes you miss opportunities.
// 2. Changing RR to 4:1 times ATR works better.

//@version=4
strategy(title="3 EMA + Stochastic RSI + ATR", shorttitle="3ESRA", overlay=true, pyramiding=1,
     process_orders_on_close=true, calc_on_every_tick=true,
     initial_capital=1000, currency = currency.USD, default_qty_value=10,
     default_qty_type=strategy.percent_of_equity,
     commission_type=strategy.commission.percent, commission_value=0.1, slippage=2)

startDate = input(title="Start Date", type=input.integer,
     defval=1, minval=1, maxval=31, group="Backtesting range")
startMonth = input(title="Start Month", type=input.integer,
     defval=1, minval=1, maxval=12, group="Backtesting range")
startYear = input(title="Start Year", type=input.integer,
     defval=1900, minval=1800, maxval=2100, group="Backtesting range")
endDate = input(title="End Date", type=input.integer,
     defval=1, minval=1, maxval=31, group="Backtesting range")
endMonth = input(title="End Month", type=input.integer,
     defval=1, minval=1, maxval=12, group="Backtesting range")
endYear = input(title="End Year", type=input.integer,
     defval=2040, minval=1800, maxval=2100, group="Backtesting range")

// Date range filtering
inDateRange = (time >= timestamp(syminfo.timezone, startYear, startMonth, startDate, 0, 0)) and
     (time < timestamp(syminfo.timezone, endYear, endMonth, endDate, 23, 59))

fast = input(8, minval=8, title="Fast EMA", group="EMAs")
medium = input(14, minval=8, title="Medium EMA", group="EMAs")
slow = input(50, minval=8, title="Slow EMA", group="EMAs")
src = input(close, title="Source")

smoothK = input(3, "K", minval=1, group="Stoch-RSI", inline="K&D")
smoothD = input(3, "D", minval=1, group="Stoch-RSI", inline="K&D")
lengthRSI = input(14, "RSI Length", minval=1, group="Stoch-RSI", inline="length")
lengthStoch = input(14, "Stochastic Length", minval=1, group="Stoch-RSI", inline="length")
rsiSrc = input(close, title="RSI Source", group="Stoch-RSI")

length = input(title="Length", defval=14, minval=1, group="ATR")
smoothing = input(title="Smoothing", defval="RMA", options=["RMA", "SMA", "EMA", "WMA"], group="ATR")

// EMAs
fastema = ema(src, fast)
mediumema = ema(src, medium)
slowema = ema(src, slow)

// S-RSI
rsi1 = rsi(rsiSrc, lengthRSI)
k = sma(stoch(rsi1, rsi1, rsi1, lengthStoch), smoothK)
d = sma(k, smoothD)
sRsiCrossOver = k[1] < d[1] and k > d
sRsiCrossUnder = k[1] > d[1] and k < d

// ATR
ma_function(source, length) =>
	if smoothing == "RMA"
		rma(source, length)
	else
		if smoothing == "SMA"
			sma(source, length)
		else
			if smoothing == "EMA"
				ema(source, length)
			else
				wma(source, length)
atr = ma_function(tr(true), length)

// Trading Logic
longCond1 = (fastema > mediumema) and (mediumema > slowema)
longCond2 = true
// longCond2 = sRsiCrossOver
longCond3 = close > fastema
longCond4 = strategy.position_size <= 0
longCond = longCond1 and longCond2 and longCond3 and longCond4 and inDateRange

shortCond1 = (fastema < mediumema) and (mediumema < slowema)
shortCond2 = true
// shortCond2 = sRsiCrossUnder
shortCond3 = close < fastema
shortCond4 = strategy.position_size >= 0
shortCond = shortCond1 and shortCond2 and shortCond3 and shortCond4 and inDateRange

var takeProfit = float(na), var stopLoss = float(na)
if longCond and strategy.position_size <= 0
    takeProfit := close + 4*atr
    stopLoss := close - 1*atr
    // takeProfit := close + 2*atr
    // stopLoss := close - 3*atr

else if shortCond and strategy.position_size >= 0
    takeProfit := close - 4*atr
    stopLoss := close + 1*atr
    // takeProfit := close - 2*atr
    // stopLoss := close + 3*atr

// Strategy calls
strategy.entry("3ESRA", strategy.long, comment="Long", when=longCond and strategy.position_size <= 0)
strategy.entry("3ESRA", strategy.short, comment="Short", when=shortCond and strategy.position_size >= 0)
strategy.exit(id="TP-SL", from_entry="3ESRA", limit=takeProfit, stop=stopLoss)
if (not inDateRange)
    strategy.close_all()

// Plot EMAs
plot(fastema, color=color.purple, linewidth=2, title="Fast EMA")
plot(mediumema, color=color.teal, linewidth=2, title="Medium EMA")
plot(slowema, color=color.yellow, linewidth=2, title="Slow EMA")
// Plot S-RSI
// plotshape((strategy.position_size > 0) ? na : sRsiCrossOver, title="StochRSI Cross Over", style=shape.triangleup, location=location.belowbar, color=color.teal, text="SRSI", size=size.small)
// Plot trade
bgcolor(strategy.position_size > 0 ? color.new(color.green, 75) : strategy.position_size < 0 ? color.new(color.red,75) : color(na))
// Plot Strategy
plot((strategy.position_size != 0) ? takeProfit : na, style=plot.style_linebr, color=color.green, title="TP")
plot((strategy.position_size != 0) ? stopLoss : na, style=plot.style_linebr, color=color.red, title="SL")