Titik Pivot Tinggi Rangka Masa Multi Rendah
Penulis:ChaoZhang, Tarikh: 2022-05-16 15:12:10Tag:Pivot
Halo semua,
Terdapat terbina dalam dan diterbitkan Pivot Point High Low indikator di Perpustakaan Awam tetapi sejauh yang saya lihat tidak ada yang untuk bingkai masa yang lebih tinggi. jadi saya memutuskan untuk menulis & menerbitkan skrip ini. Saya harap ia akan berguna semasa perdagangan atau membangunkan skrip anda sendiri. Saya juga melakukan ini untuk digunakan dalam salah satu projek masa depan saya (kita akan melihatnya dalam beberapa minggu / bulan ;)).
Saya cuba untuk membuat semua tetapan pilihan, jadi anda boleh bermain dengan mereka seperti yang anda mahu.
P.S. Tiada mekanisme kawalan jika jangka masa carta adalah lebih rendah daripada jangka masa dalam pilihan. jadi anda lebih baik menetapkan jangka masa yang lebih tinggi dalam pilihan daripada jangka masa carta.
Nikmatilah!
Ujian belakang
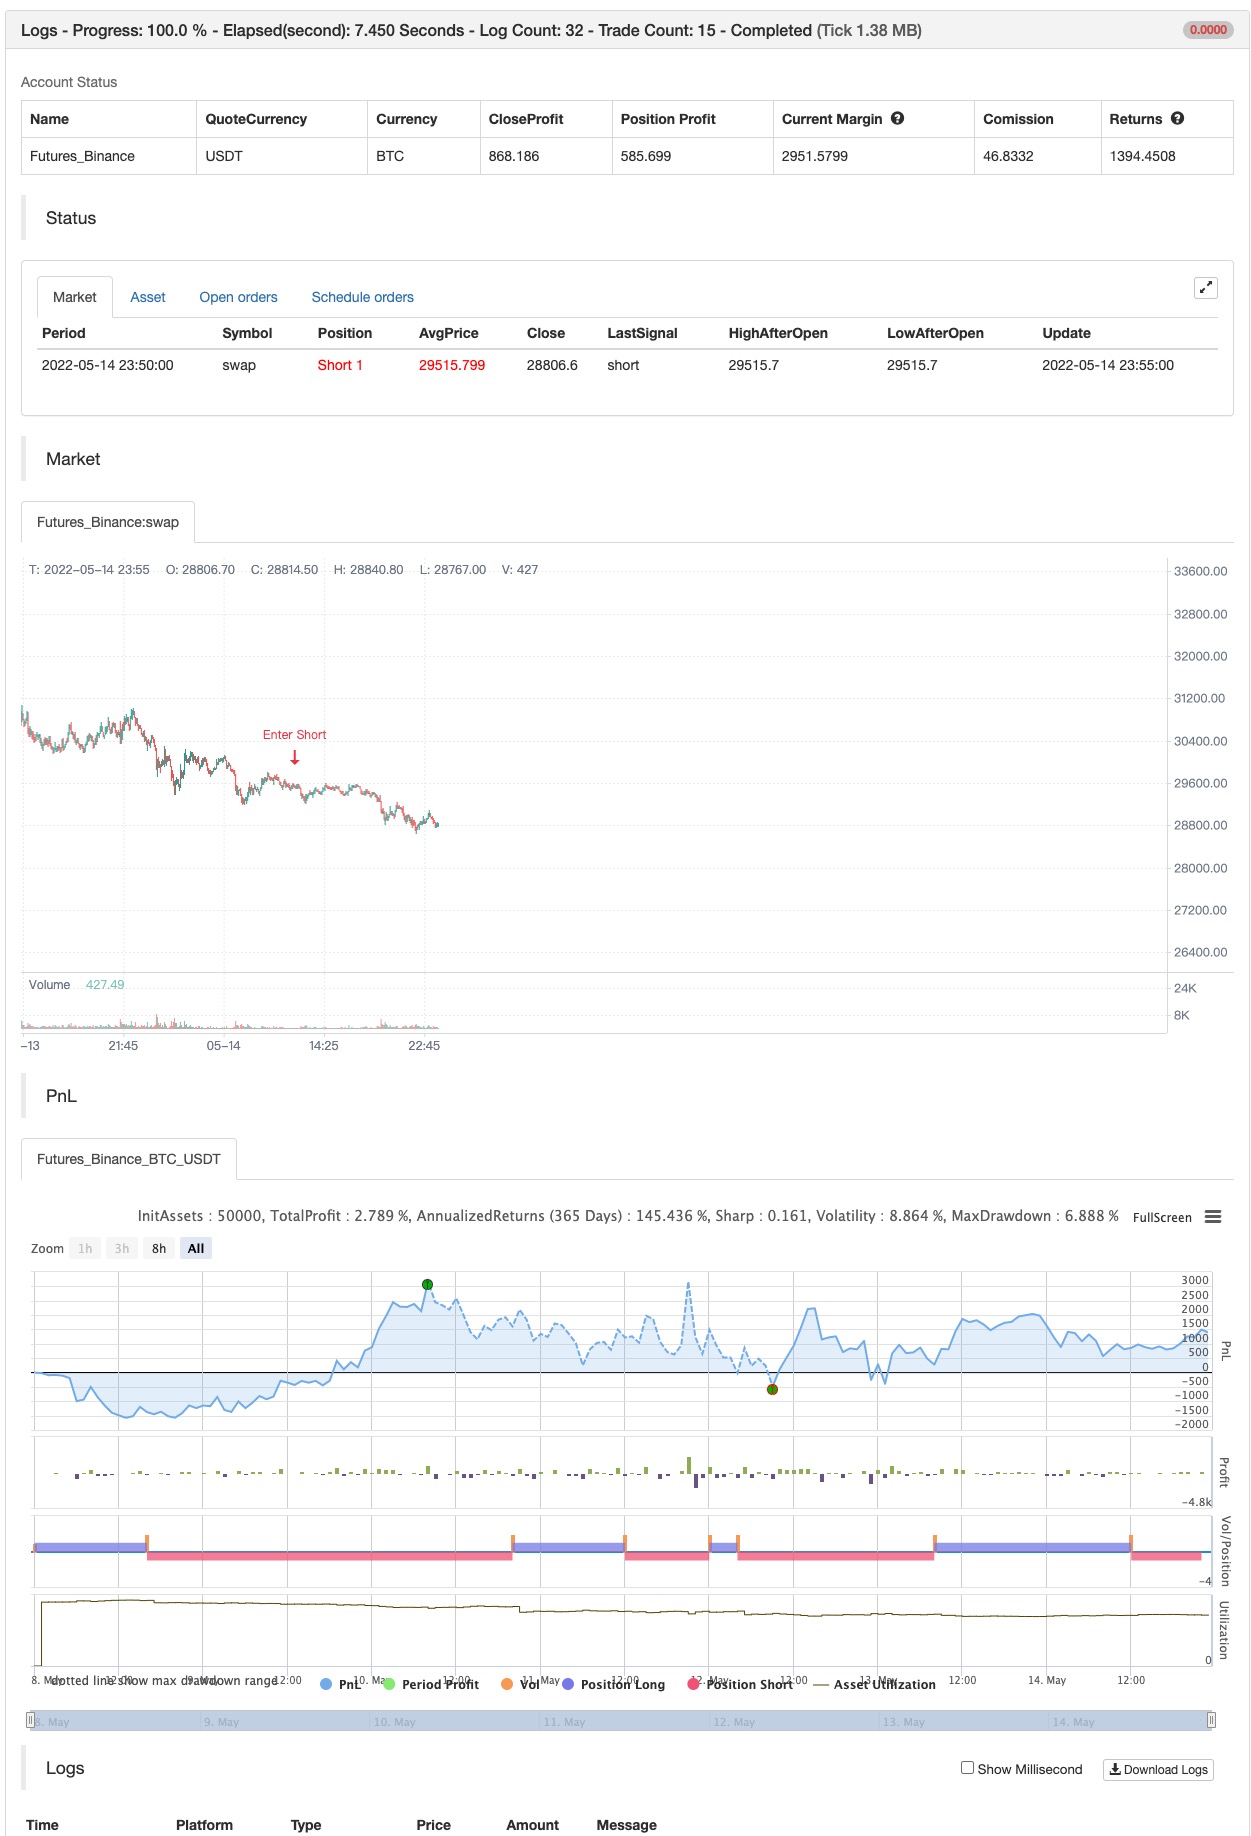
/*backtest
start: 2022-05-08 00:00:00
end: 2022-05-14 23:59:00
period: 5m
basePeriod: 1m
exchanges: [{"eid":"Futures_Binance","currency":"BTC_USDT"}]
*/

// This source code is subject to the terms of the Mozilla Public License 2.0 at https://mozilla.org/MPL/2.0/
// © LonesomeTheBlue

//@version=5
indicator("Pivot Points High Low Multi Time Frame", overlay = true, max_lines_count = 500, max_labels_count = 500)
timeframe = input.timeframe(defval = '240')
leftBars  = input.int(defval = 2, title = "Left Bars", minval = 1)
rightBars  = input.int(defval = 2, title = "Right Bars", minval = 1)
phlinecol = input(defval = color.lime, title = "Pivot High/Low Line Colors", inline = "lc")
pllinecol = input(defval = color.red, title = "", inline = "lc")
phbgcol = input(defval = color.lime, title = "Pivot High BG/Text Colors", inline = "ph")
phtextcol = input(defval = color.black, title = "", inline = "ph")
plbgcol = input(defval = color.red, title = "Pivot Low BG/Text Colors", inline = "pl")
pltextcol = input(defval = color.white, title = "", inline = "pl")

get_phpl()=>
    float ph = ta.pivothigh(leftBars, rightBars)
    float pl = ta.pivotlow(leftBars, rightBars)
    phtimestart = ph ? time[rightBars] : na
    phtimeend = ph ? time[rightBars - 1] : na
    pltimestart = pl ? time[rightBars] : na
    pltimeend = pl ? time[rightBars - 1] : na

    [ph, phtimestart, phtimeend, pl, pltimestart, pltimeend]

// get if there if Pivot High/low and their start/end times
[ph, phtimestart, phtimeend, pl, pltimestart, pltimeend] = request.security(syminfo.tickerid, timeframe, get_phpl(), lookahead = barmerge.lookahead_on)

// keep time of each bars, this is used for lines/labels
var mytime = array.new_int(0)
array.unshift(mytime, time)

// calculate end of the line/time for pivot high/low
bhend = array.get(mytime, math.min(array.indexof(mytime, phtimeend) + 1, array.size(mytime) - 1))
blend = array.get(mytime, math.min(array.indexof(mytime, pltimeend) + 1, array.size(mytime) - 1))

// to draw once
float pivothigh = na(ph[1]) and ph ? ph : na
float pivotlow  = na(pl[1]) and pl ? pl : na


if not na(pivothigh)
    strategy.entry("Enter Long", strategy.long)
else if not na(pivotlow)
    strategy.entry("Enter Short", strategy.short)
- Indikator Perbezaan RSI
- Trend Pivot
- Perbezaan Volume
- Pivot Berasaskan Trailing Maxima & Minima
- Titik Pivot Supertrend
- Villa Dinamic Pivot Supertrend Strategi
- Blok Perintah Pivot
- Pulangan Bulanan dalam Strategi PineScript
- Pembunuh Sma BTC
- Templat amaran ML
- Perkembangan Fibonacci Dengan Jurang
- RSI MTF Ob+Os
- Fukuiz Octa-EMA + Ichimoku
- CCI MTF Ob+Os
- MACD yang lebih bijak
- Strategi OCC R5.1
- Selamat datang di BEARMARKET [30 MIN]
- Sidboss
- Ghosts Trend Tracking Strategy Database
- Ghoul Trend Track Strategi Perpustakaan Perniagaan
- Strategi Pengesanan Tren Hantu
- Oscillator Pelangi
- Contoh Pengukuran Posisi Lorong Ekuiti
- KLineChart Demo
- Villa Dinamic Pivot Supertrend Strategi
- Supertrend Crodl
- RSI oleh zdmre
- FTL - Penapis Julat X2 + EMA + UO