Trend Fukuiz
Penulis:ChaoZhang, Tarikh: 2022-05-18 10:25:47Tag:RMARSI
Indikator ini berasaskan RSI dari 2 tempoh yang berbeza.
# Pendahuluan ringkas kepada RSI # Indeks kekuatan relatif (RSI) adalah penunjuk momentum yang digunakan dalam analisis teknikal yang mengukur besarnya perubahan harga baru-baru ini untuk menilai keadaan overbought atau oversold dalam harga saham atau aset lain. RSI dipaparkan sebagai osilator (graf garis yang bergerak antara dua ekstrem) dan boleh mempunyai bacaan dari 0 hingga 100.
Tafsiran dan penggunaan tradisional RSI adalah bahawa nilai 70 atau lebih menunjukkan bahawa sekuriti menjadi terlalu banyak dibeli atau terlalu dinilai dan mungkin disiapkan untuk pembalikan trend atau penarikan semula harga.
# Dalam penunjuk ini # Saya melihat bahawa anda boleh menggunakan 2 RSI dengan tempoh yang berbeza untuk mencadangkan trend Bullish dan trend Bearish.
# Keadaan antara RSI pendek dan panjang melintasi # Crossover = Trend Bullish (zon biru) Crossunder = Trend Buruh (zon merah)
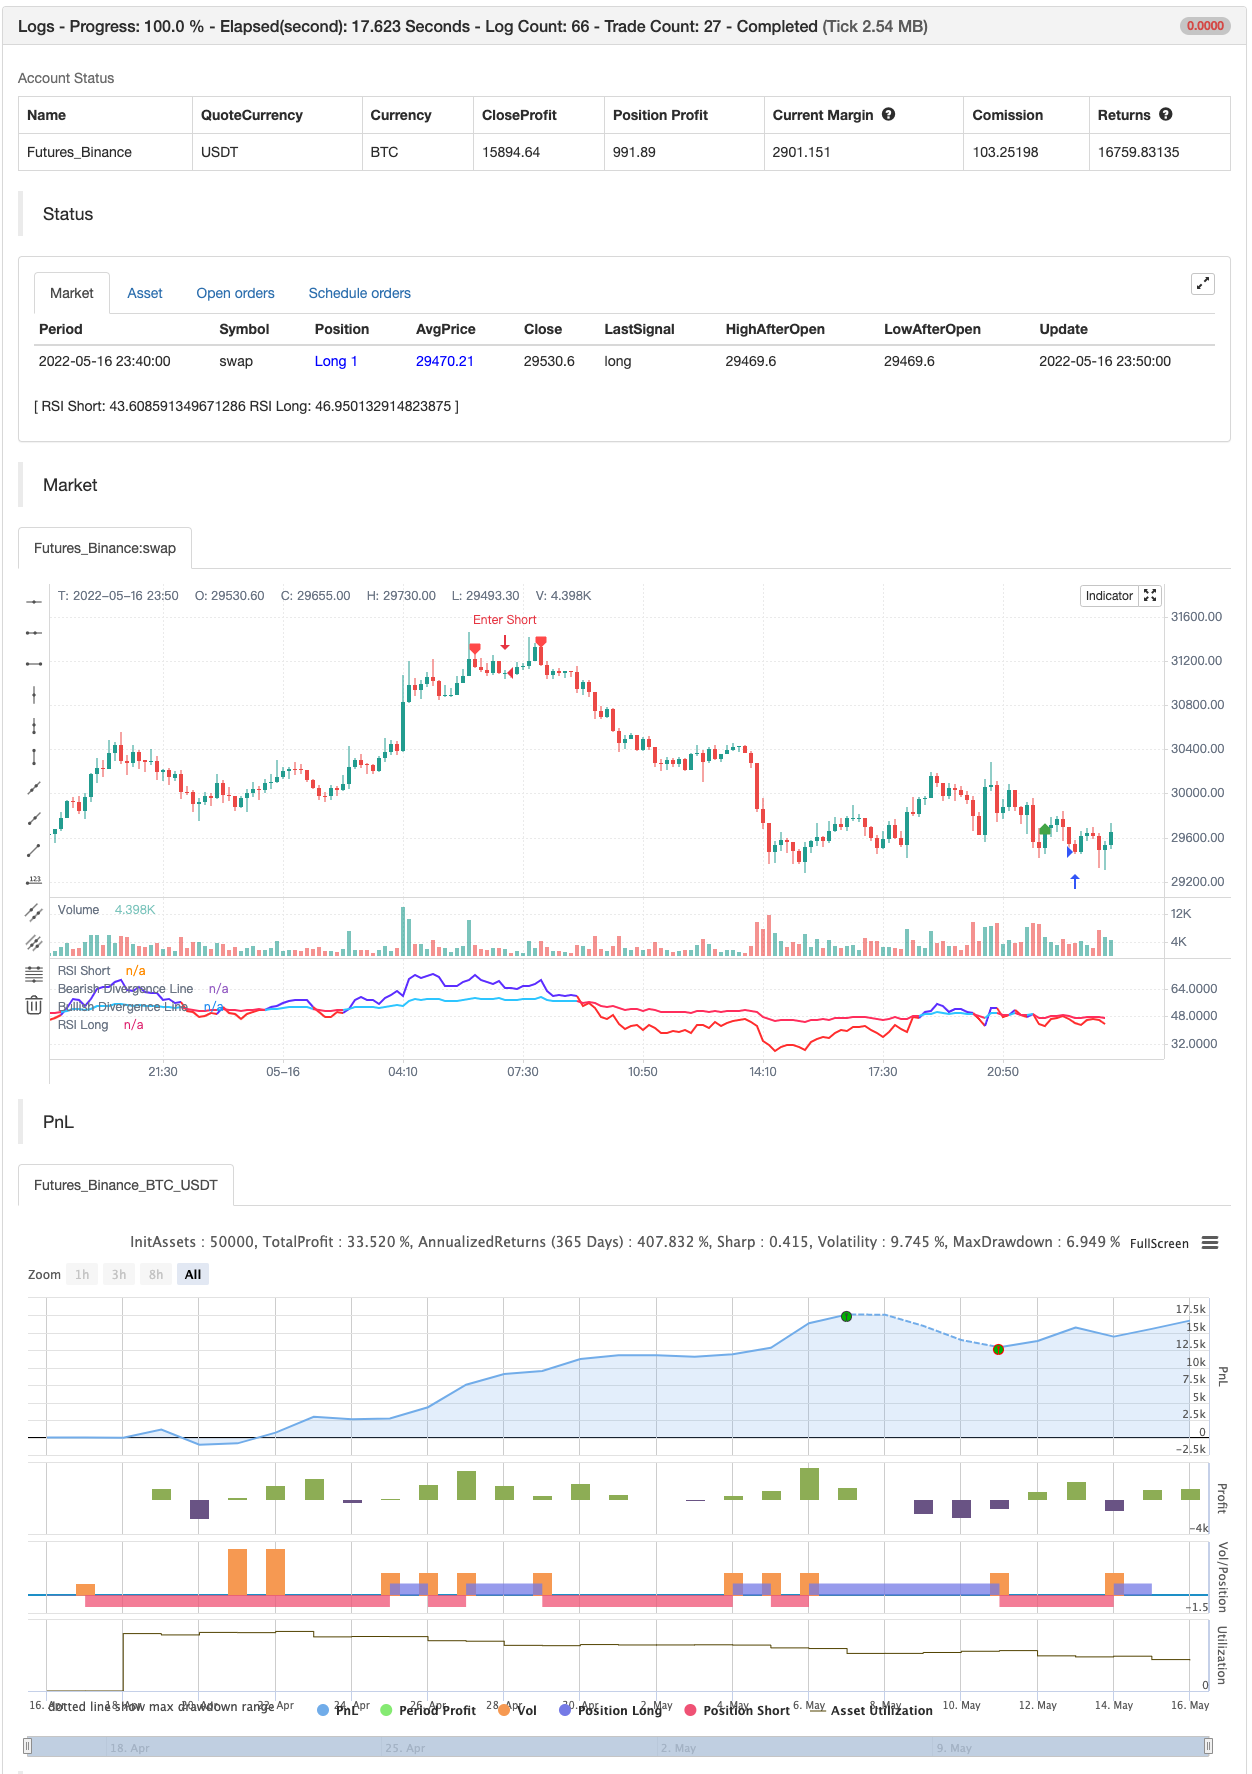
Pengujian belakang
/*backtest
start: 2022-04-17 00:00:00
end: 2022-05-16 23:59:00
period: 10m
basePeriod: 1m
exchanges: [{"eid":"Futures_Binance","currency":"BTC_USDT"}]
*/

//@version=5
//Fukuiz
indicator(title='Fukuiz Trend', shorttitle='Fukuiz Trend', format=format.price, precision=2, timeframe='')

//color//
colorwhite = #FFFFFF
colorblue = #6633FF
colorred = #FF3333
colorblue2 = #33CCFF
colorpink = #FF3366

//Fuction//
len = input.int(24, minval=1, title='RSI Short')
len2 = input.int(100, minval=1, title='RSI Long')
src = input(open, 'Source')
up = ta.rma(math.max(ta.change(src), 0), len)
down = ta.rma(-math.min(ta.change(src), 0), len)
up2 = ta.rma(math.max(ta.change(src), 0), len2)
down2 = ta.rma(-math.min(ta.change(src), 0), len2)
rsi = down == 0 ? 100 : up == 0 ? 0 : 100 - 100 / (1 + up / down)
rsi2 = down2 == 0 ? 100 : up2 == 0 ? 0 : 100 - 100 / (1 + up2 / down2)

Bullish = rsi > rsi2
Bearish = rsi < rsi2
Fukuizcolor = Bullish ? color.new(colorblue,0) : Bearish ? color.new(colorred,0) : na
Fukuizcolor2 = Bullish ? color.new(colorblue2,0) : Bearish ? color.new(colorpink,0) : na
Fukuizcolor3 = Bullish ? color.new(colorblue,75) : Bearish ? color.new(colorred,75) : na

//Plot//
l1 = plot(rsi, 'RSI Short', color=Fukuizcolor, linewidth=2, style=plot.style_line)
l2 = plot(rsi2, 'RSI Long', color=Fukuizcolor2, linewidth=2, style=plot.style_line)
band2 = hline(50, 'Middle Band', color=#FFCC99)
band1 = hline(70, 'Upper Band', color=#FFCC99)
band0 = hline(30, 'Lower Band', color=#FFCC99)
fill(band1, band0, color.new(#0946CA, 90), title='Background')
fill(l1, l2, color=Fukuizcolor3, title='Trend Background')


//DIVERGENCE//
lbR = input(title='Pivot Lookback Right', defval=5)
lbL = input(title='Pivot Lookback Left', defval=5)
rangeUpper = input(title='Max of Lookback Range', defval=60)
rangeLower = input(title='Min of Lookback Range', defval=5)
plotBull = input(title='Bullish Divergence', defval=true)
plotBear = input(title='Bearish Divergence', defval=true)
bearColor = color.red
bullColor = color.green
hiddenBullColor = color.new(color.green, 80)
hiddenBearColor = color.new(color.red, 80)
textColor = color.white
noneColor = color.new(color.white, 100)
osc = ta.rsi(src, len)

plFound = na(ta.pivotlow(osc, lbL, lbR)) ? false : true
phFound = na(ta.pivothigh(osc, lbL, lbR)) ? false : true
_inRange(cond) =>
    bars = ta.barssince(cond == true)
    rangeLower <= bars and bars <= rangeUpper

oscHL = osc[lbR] > ta.valuewhen(plFound, osc[lbR], 1) and _inRange(plFound[1])
priceLL = low[lbR] < ta.valuewhen(plFound, low[lbR], 1)
bullCond = plotBull and priceLL and oscHL and plFound

plot(plFound ? osc[lbR] : na, offset=-lbR, title='Bullish Divergence Line', linewidth=2, color=bullCond ? bullColor : noneColor,display=display.none)

plotshape(bullCond ? osc[lbR] : na, offset=-lbR, title='Bullish Divergence Label', text=' Bull ', style=shape.labelup, location=location.absolute, color=color.new(bullColor, 0), textcolor=color.new(textColor, 0))

oscLH = osc[lbR] < ta.valuewhen(phFound, osc[lbR], 1) and _inRange(phFound[1])
priceHH = high[lbR] > ta.valuewhen(phFound, high[lbR], 1)
bearCond = plotBear and priceHH and oscLH and phFound

plot(phFound ? osc[lbR] : na, offset=-lbR, title='Bearish Divergence Line', linewidth=2, color=bearCond ? bearColor : noneColor,display=display.none)

plotshape(bearCond ? osc[lbR] : na, offset=-lbR, title='Bearish Divergence Label', text=' Bear ', style=shape.labeldown, location=location.absolute, color=color.new(bearColor, 0), textcolor=color.new(textColor, 0))


if bullCond
    strategy.entry("Enter Long", strategy.long)
else if bearCond
    strategy.entry("Enter Short", strategy.short)
- Super Scalper - 5 minit 15 minit
- Scalping EMA ADX RSI dengan Beli / Jual
- RSI - Isyarat Beli Jual
- RSI strategi perbelanjaan
- Strategi Indeks Kekuatan Relatif RSI
- RSI oleh zdmre
- RSI MTF Ob+Os
- TMA-Legacy
- SuperTREX
- Bollinger + RSI, Strategi Ganda v1.1
- CM MACD Indikator Sesuai - Kerangka Masa Berbilang - V2
- HODL LINE
- 2 Pengesanan Arah Rata-rata Bergerak Warna
- Scalping PullBack Tool R1
- Strategi Beli&Jual bergantung kepada AO+Stoch+RSI+ATR
- EMA TREND CLOUD
- Rasio Tenaga Arah RedK Volume-Pengcepat
- Donchian Breakout tiada cat semula
- Bar Momentum RedK
- SuperJump Turn Back Bollinger Band
- BOT Johny
- SSL Hibrid
- Keluar Chandelier
- Risotto
- EMA Cloud Intraday Strategi
- Titik Pivot Supertrend
- Supertrend+4 bergerak
- ZigZag berasaskan momentum
- VuManChu Cipher B + Strategi Perbezaan
- Konsep Dual SuperTrend