RedK Dual VADER dengan Bar Tenaga
Penulis:ChaoZhang, Tarikh: 2022-05-24 11:49:07Tag:SMAEMAWMA
Penambahbaikan visual yang saya tambahkan dalam VADER-DEB membantu membawa lebih banyak wawasan mengenai tindakan pasaran dengan
- mendedahkan grafik VADER ganda / panjang secara lalai (yang kita gunakan sebagai proksi untuk sentimen) - dan ia menunjukkan sekarang sebagai kawasan (bukan histogram) - Anda masih boleh menyembunyikan grafik sentimen dalam tetapan penunjuk dan
- menggunakan
bar tenaga arah (bukan garis tenaga dalam v3.0). Lini DER Merah/Hijau pilihan tersedia dalam tetapan kajian dan disembunyikan secara lalai.
Jadi ini adalah Dual VADER w/ Energy Bars
Perubahan ini mungkin dianggap oleh sesetengah orang sebagai kecil, tetapi pada pandangan saya, saya mendapati mereka lebih menarik secara visual dan lebih baik untuk
Tidak ada perubahan dalam pengiraan teras dalam kod. Seperti yang ditunjukkan oleh carta di atas di mana kita membandingkan kedua-dua versi VADER bersebelahan.
Jika anda berpuas hati dengan VADER v3.0, sila terus menggunakannya.
Semoga berjaya!
Ujian belakang
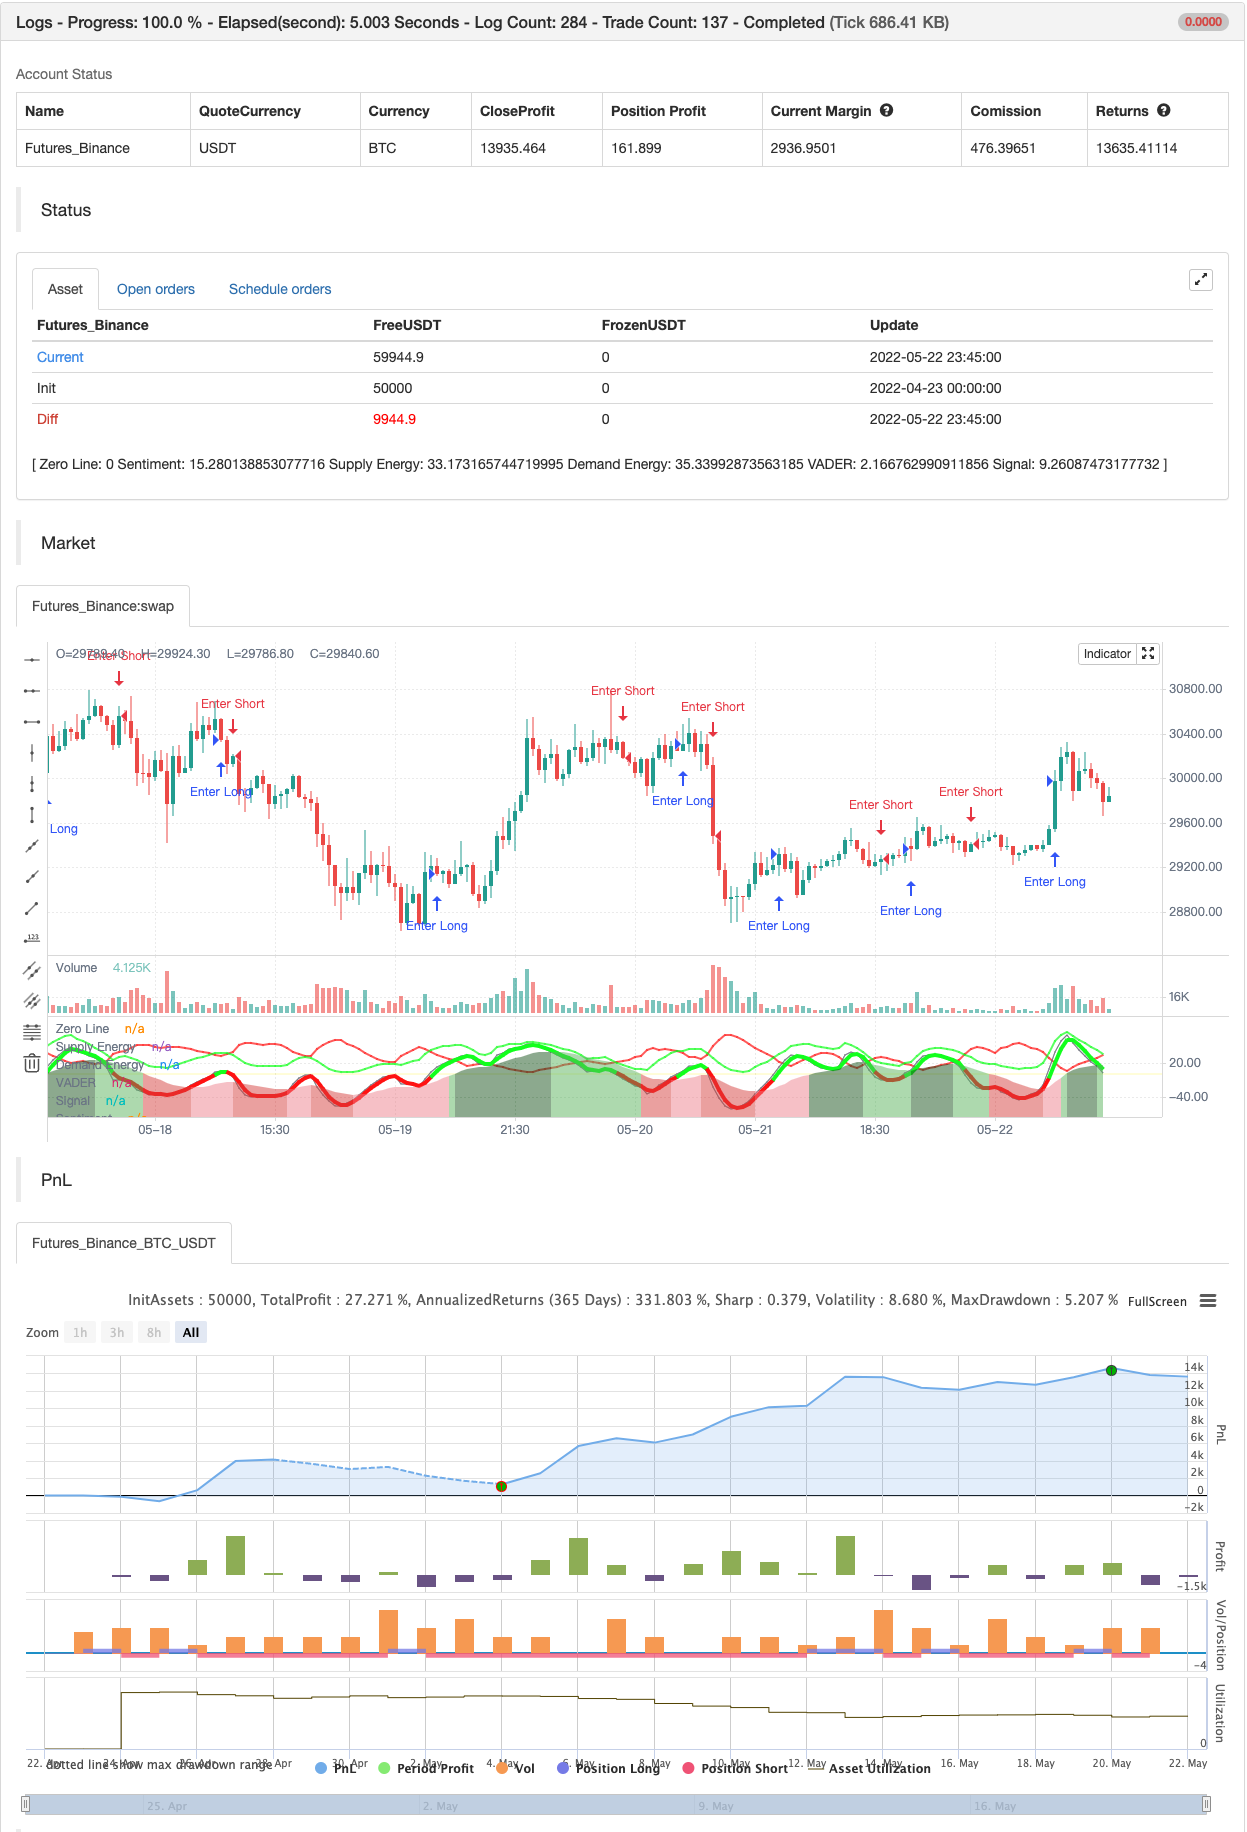
/*backtest
start: 2022-04-23 00:00:00
end: 2022-05-22 23:59:00
period: 45m
basePeriod: 5m
exchanges: [{"eid":"Futures_Binance","currency":"BTC_USDT"}]
*/

// This source code is subject to the terms of the Mozilla Public License 2.0 at https://mozilla.org/MPL/2.0/
// © RedKTrader

//@version=5
indicator('RedK Dual VADER with Energy Bars [VADER-DEB]', 'RedK VADER-DEB v4.0', precision=0, timeframe='', timeframe_gaps=false)

// This version is the same as VADER v3.0 with enhanced visuals, using Energy Bars instead of the positive/energy lines
// Sentiment plot changed from histogram to area and is exposed by default (hence Dual w/ Energy Bars -- DEB)
// No change in core calculations from VADER v3.0  -- and that's why i'll just call it VADER v4.0

// ***********************************************************************************************************
// Choose volume calculation method.. Relative vs full.
// Relative magnifies effect of recent volume spikes (up or down)
f_RelVol(_value, _length) =>
    min_value = ta.lowest(_value, _length)
    max_value = ta.highest(_value, _length)
    ta.stoch(_value, max_value, min_value, _length) / 100
// ***********************************************************************************************************

// ***********************************************************************************************************
// Choose MA type for the base DER calculation ..
// WMA is my preference and is default .. SMA is really slow and lags a lot - but added for comparison
f_derma(_data, _len, MAOption) =>
    value =
      MAOption == 'SMA' ? ta.sma(_data, _len) :
      MAOption == 'EMA' ? ta.ema(_data, _len) :
      ta.wma(_data, _len)
// ***********************************************************************************************************


// ===========================================================================================================
//      Inputs
// ===========================================================================================================

price   = close
length  = input.int(10, minval=1)
DER_avg = input.int(5, 'Average', minval=1, inline='DER', group='Directional Energy Ratio')
MA_Type = input.string('WMA', 'DER MA type', options=['WMA', 'EMA', 'SMA'], inline='DER', group='Directional Energy Ratio')
smooth  = input.int(3, 'Smooth', minval=1,  inline='DER_1', group='Directional Energy Ratio')

show_senti = input.bool(true, 'Sentiment',  inline='DER_s', group='Directional Energy Ratio')
senti   = input.int(20, 'Length', minval=1, inline='DER_s', group='Directional Energy Ratio')


v_calc  = input.string('Relative', 'Calculation', options=['Relative', 'Full', 'None'], group='Volume Parameters')
vlookbk = input.int(20, 'Lookback (for Relative)', minval=1,                            group='Volume Parameters')

// ===========================================================================================================
//          Calculations
// ===========================================================================================================

// Volume Calculation Option  -- will revert to no volume acceleration for instruments with no volume data
vola    =
  v_calc == 'None' or na(volume) ? 1 :
  v_calc == 'Relative' ? f_RelVol(volume, vlookbk) :
  volume

R       = (ta.highest(2) - ta.lowest(2)) / 2                    // R is the 2-bar average bar range - this method accomodates bar gaps
sr      = ta.change(price) / R                                  // calc ratio of change to R
rsr     = math.max(math.min(sr, 1), -1)                         // ensure ratio is restricted to +1/-1 in case of big moves
c       = fixnan(rsr * vola)                                    // add volume accel -- fixnan adresses cases where no price change between bars

c_plus  = math.max(c, 0)                                        // calc directional vol-accel energy
c_minus = -math.min(c, 0)

// plot(c_plus)
// plot(c_minus)


avg_vola    = f_derma(vola, length, MA_Type)
dem         = f_derma(c_plus, length, MA_Type)  / avg_vola          // directional energy ratio
sup         = f_derma(c_minus, length, MA_Type) / avg_vola

adp         = 100 * ta.wma(dem, DER_avg)                            // average DER
asp         = 100 * ta.wma(sup, DER_avg)
anp         = adp - asp                                             // net DER..
anp_s       = ta.wma(anp, smooth)

// Calculate Sentiment - a VADER for a longer period and can act as a baseline (compared to a static 0 value)
// note we're not re-calculating vol_avg, demand or supply energy for sentiment. this would've been a different approach
s_adp       = 100 * ta.wma(dem, senti)                            // average DER for sentiment length
s_asp       = 100 * ta.wma(sup, senti)
V_senti     = ta.wma(s_adp - s_asp, smooth)


// ===========================================================================================================
//      Colors & plots
// ===========================================================================================================
c_adp   = color.new(#11ff20, 30)
c_asp   = color.new(#ff1111, 30)
c_fd    = color.new(color.green, 80)
c_fs    = color.new(color.red, 80)
c_zero  = color.new(#ffee00, 70)

c_up    = color.new(#11ff20, 0)
c_dn    = color.new(#ff1111, 0)

up      = anp_s >= 0
s_up    = V_senti >=0

hline(0, 'Zero Line', c_zero, hline.style_solid)

// =============================================================================
// v4.0 --- Sentiment will be represented as a 4-color area graph
c_grow_above = #1b5e2080
c_grow_below = #dc4c4a80
c_fall_above = #66bb6a80
c_fall_below = #ef8e9880

sflag_up = math.abs(V_senti) >= math.abs(V_senti[1])

plot(show_senti ? V_senti : na, "Sentiment", style=plot.style_area,
 color = s_up ? (sflag_up ? c_grow_above : c_fall_above) :
 sflag_up ? c_grow_below : c_fall_below)

// ===========================================================================================================
//      v4.0 Use Energy Bars instead of DER lines
// ===========================================================================================================

// Prep the Energy Bars
bo = asp
bc = adp
bh = math.max(bo, bc)
bl = math.min(bo, bc)

rising      = ta.change(bc) > 0

c_barup     = #11ff2088
c_bardn     = #ff111188
c_bardj     = #ffffff88

barcolor    = bc > bo and rising ? c_barup : bc < bo and not rising ? c_bardn : c_bardj
//plotcandle(bo, bh, bl, bc, 'Energy Bars', barcolor, barcolor, bordercolor = barcolor)

// ============================================================================================================

s = plot(asp, 'Supply Energy', c_asp, 2, display = display.none)
d = plot(adp, 'Demand Energy', c_adp, 2, display = display.none)

plot(anp, 'VADER', color.new(color.gray, 30), display=display.none)
plot(anp_s, 'Signal', up ? c_up : c_dn, 4)

// ===========================================================================================================
//      v2.0 adding alerts
// ===========================================================================================================

Alert_up    = ta.crossover(anp_s,0)
Alert_dn    = ta.crossunder(anp_s,0)
Alert_swing = ta.cross(anp_s,0)

// "." in alert title for the alerts to show in the right order up/down/swing
alertcondition(Alert_up,    ".   VADER Crossing 0 Up",      "VADER Up - Buying Energy Detected!")
alertcondition(Alert_dn,    "..  VADER Crossing 0 Down",    "VADER Down - Selling Energy Detected!")
alertcondition(Alert_swing, "... VADER Crossing 0",         "VADER Swing - Possible Reversal")

// ===========================================================================================================
//      v3.0 more alerts for VADER crossing Sentiment
// ===========================================================================================================

v_speedup = ta.crossover(anp_s, V_senti)
v_slowdn  = ta.crossunder(anp_s, V_senti)
alertcondition(v_speedup,   "*  VADER Speeding Up",      "VADER Speeding Up!")
alertcondition(v_slowdn,    "** VADER Slowing Down",    "VADER Slowing Down!")


if Alert_up
    strategy.entry("Enter Long", strategy.long)
else if Alert_dn
    strategy.entry("Enter Short", strategy.short)
- Strategi Dagangan Kuantitatif Berdasarkan Purata Bergerak dan Bollinger Bands
- Amaran rentas rata-rata bergerak, pelbagai jangka masa (MTF)
- HALFTREND + HEMA + SMA (Strategi Isyarat Palsu)
- Rasio Tenaga Arah RedK Volume-Pengcepat
- Oscillator Pelangi
- Bar Momentum RedK
- ESSMA
- Super Scalper
- SuperJump Turn Back Bollinger Band
- MACD yang lebih bijak
- BEST Engulfing + Breakout Strategi
- Bollinger Awesome Alert R1
- Plugin yang disambungkan ke pelbagai bursa
- Ganjaran segitiga (menghasilkan mata wang kecil dengan harga yang berbeza)
- bybit reverse contract dynamic grid (grid khas)
- Peringatan TradingView untuk MT4 MT5 + pembolehubah dinamik
- Siri Matriks
- Super Scalper - 5 minit 15 minit
- Indeks Kekuatan Relatif - Perbezaan - Libertus
- Regresi Linear ++
- Zon Pengukuhan - Hidup
- Perkiraan Kuantitatif Kualitatif
- Amaran rentas rata-rata bergerak, pelbagai jangka masa (MTF)
- MACD Reloaded STRATEGY
- Purata Bergerak SuperTrended
- Perdagangan ABC
- 15MIN BTCUSDTPERP BOT
- Shannon Entropy V2
- SUPERTREND ATR Dengan Pengangkutan Hentikan Hilang
- Aliran Volume v3