Strategi Indeks Pembalikan Momentum

Gambaran keseluruhan
Strategi Relative Momentum Index (RMI) adalah strategi penyesuaian berdasarkan indeks momentum. Strategi ini menilai apakah pasaran berada dalam keadaan overbought atau oversold dengan mengira dinamik perubahan harga dalam jangka masa tertentu untuk menangkap peluang berbalik.
Prinsip Strategi
Formula pengiraan untuk strategi RMI adalah seperti berikut:
javascript
xMom = xPrice - xPrice[Length] //计算Length周期内的价格变动
xMU = 如果xMom >= 0:之前xMU减去xMU/Length加上xMom;否则:之前xMU
xMD = 如果xMom <= 0:之前xMD减去xMD/Length加上xMom的绝对值;否则:0
RM = xMU / xMD
RMI = 100 * (RM / (1 + RM))
Strategi ini mula mengira perubahan harga dalam tempoh Length xMom. Jika xMom> = 0, harga naik, maka xMU ditambah xMom; jika xMom < 0, harga turun, maka xMD ditambah xMom. Nilai mutlak.
Apabila RMI lebih tinggi daripada nilai terendah SellZone, ia menunjukkan overbuy, shorting; apabila RMI lebih rendah daripada nilai terendah BuyZone, ia menunjukkan oversell, melakukan lebih banyak.
Kelebihan Strategik
- Indeks RMI lebih sensitif daripada RSI, dan lebih cepat menangkap peluang untuk membalikkan harga.
- RMI mengukur kekuatan kejatuhan dan tidak terjejas oleh peristiwa gegaran.
- RMI berdasarkan momentum, lebih tepat untuk menilai keadaan overbought dan oversold.
Risiko Strategik
- Seperti strategi pembalikan yang lain, strategi RMI mempunyai risiko untuk dibocorkan.
- Parameter RMI perlu dioptimumkan untuk pelbagai jenis, jika tidak ia mungkin tidak berkesan.
- Ia perlu untuk menetapkan paras yang munasabah untuk membeli dan menjual, atau ia akan menghasilkan terlalu banyak isyarat palsu.
Risiko boleh dikurangkan dengan cara yang sesuai untuk melonggarkan titik berhenti, mengoptimumkan kombinasi parameter, dan menggabungkan strategi trend.
Pengoptimuman Strategi
Strategi RMI boleh dioptimumkan dalam beberapa aspek:
- Optimumkan parameter Length, pilih jangka masa yang memaksimumkan keuntungan strategi.
- Mengoptimumkan had overbought dan oversold untuk mengurangkan kemungkinan isyarat palsu.
- Meningkatkan mekanisme pencegahan kerugian dan mengawal kerugian tunggal.
- Gabungan dengan trend-following atau strategi linear, meningkatkan kadar kemenangan.
- Memilih masa dagangan yang sesuai mengikut ciri-ciri pelbagai jenis untuk meningkatkan kestabilan strategi.
ringkaskan
Strategi RMI dengan mengukur perubahan dinamik harga, melakukan operasi pembalikan, dapat menangkap peluang pemulihan garis pendek dengan berkesan. Berbanding dengan strategi RSI, strategi RMI lebih sensitif dan tidak terjejas oleh guncangan.
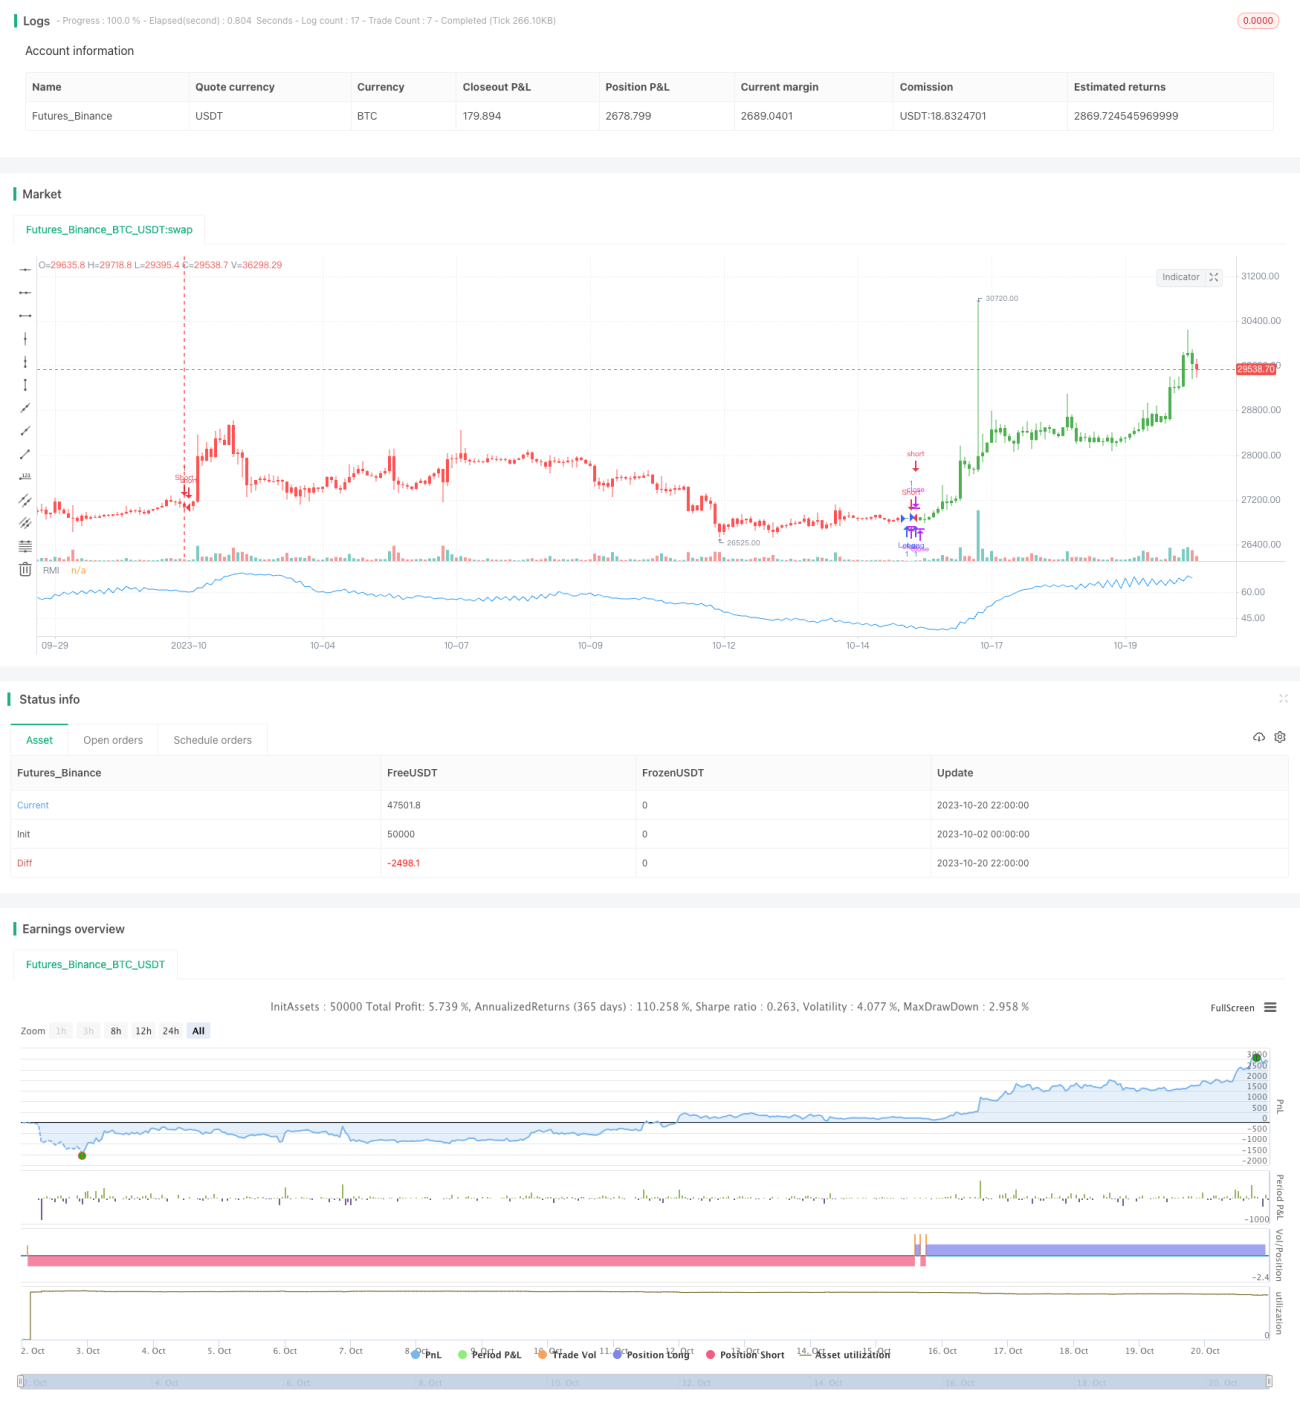
/*backtest
start: 2023-10-02 00:00:00
end: 2023-10-21 00:00:00
period: 2h
basePeriod: 15m
exchanges: [{"eid":"Futures_Binance","currency":"BTC_USDT"}]
*/

//@version=2
////////////////////////////////////////////////////////////
//  Copyright by HPotter v1.0 19/10/2017
// The Relative Momentum Index (RMI) was developed by Roger Altman. Impressed - 1