Tom DeMark Sequencial Mapa de Calor
Autora:ChaoZhang, Data: 2022-05-08 17:19:47Tags:Tendências
Este indicador usa a contagem TD Sequencial de Tom DeMark de 1 a 13.
Os números 9 e 13 normalmente identificam uma tendência esgotada e marcam uma reversão da tendência.
Os números importantes são exibidos como rótulos (7-13), onde 9 e 13 são ambos destacados como
Além dos números, as velas de preço são coloridas com base na sequência. As cores de alta estão a começar do amarelo brilhante (TD 1 = início da tendência) ao vermelho escuro (TD 13 = tendência esgotada) As cores de baixa variam de azul brilhante (TD 1 = início da tendência) a azul escuro (TD 13 = tendência esgotada)
DeMark recomenda ser usado apenas para inversões de preços de curto prazo, mas como você pode ver no gráfico, ele também funciona para gráfico LUNA 1D. Também funciona muito bem com velas Heikin Ashi.
Use-o em combinação com, por exemplo, o
Se você tem alguma idéia sobre como otimizar o código, por favor, sinta-se livre para compartilhar
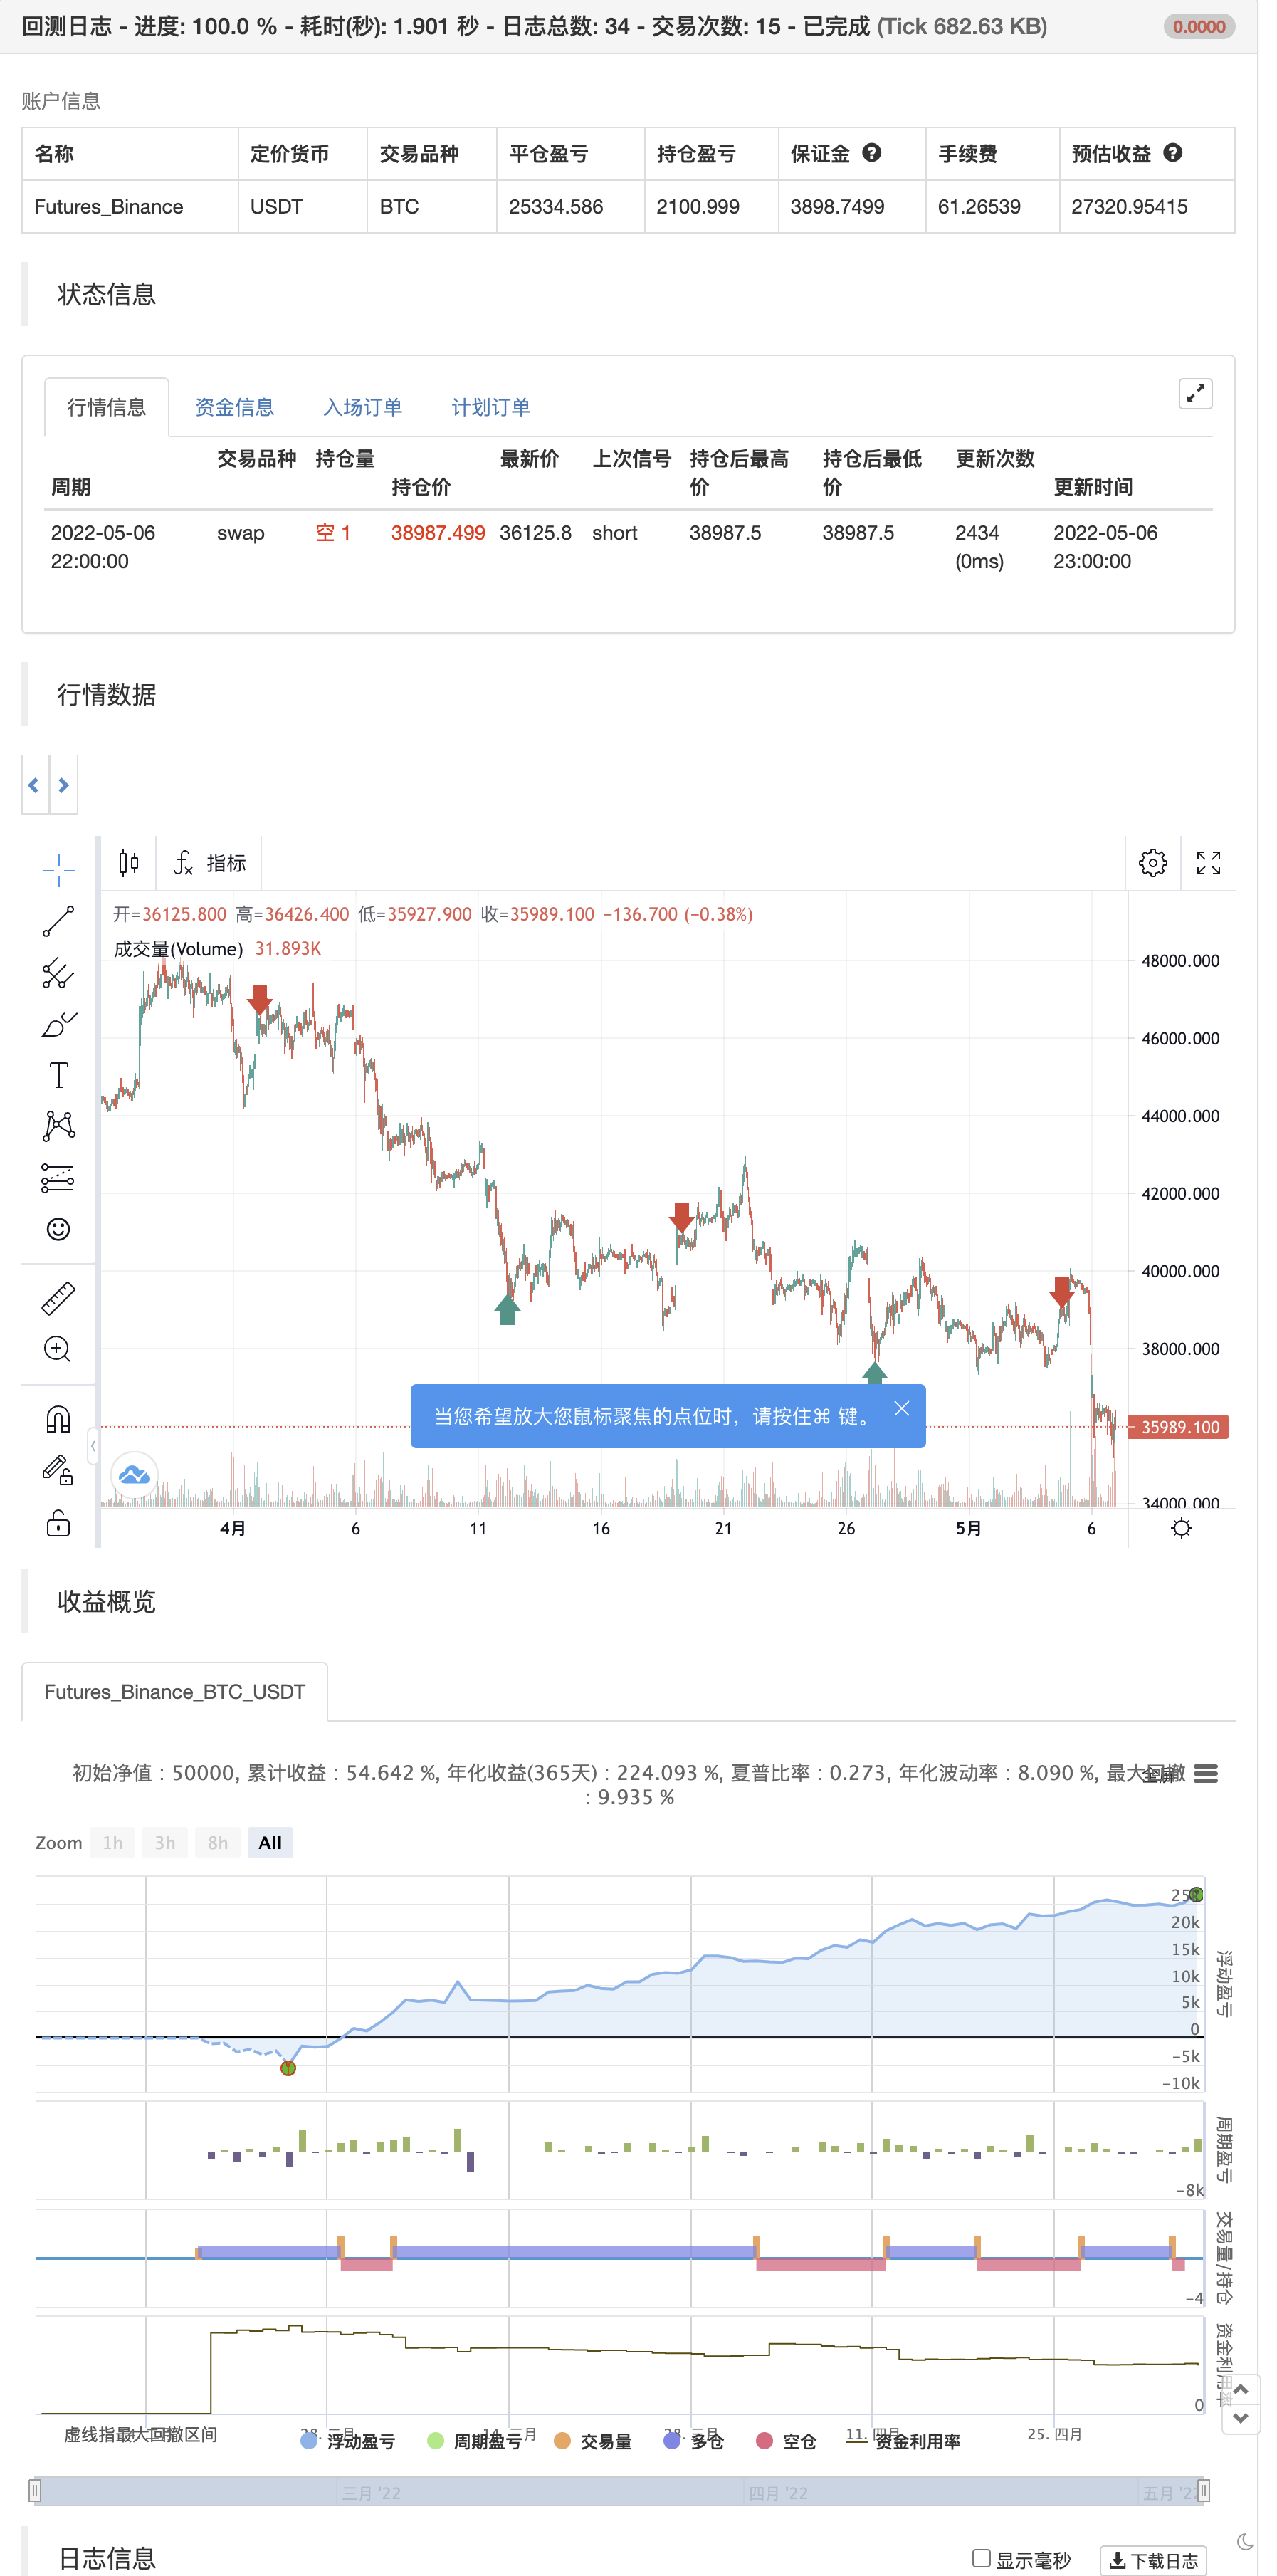
backtest
////////////////////////////////////////// Tom DeMark heatmap © by Indicator-Jones /////////////////////////////////////////
//
// This indicator uses Tom DeMark’s TD Sequential counting from 1 to 13.
// Number 9 and 13 usually identify an exhausted trend and mark trend reversal.
// The important numbers get displayed as labels (7-13), where 9 and 13 are both highlighted as "Long" or "Short".
// Besides the numbers the price candles are colored based upon the sequence.
// Bullish colors are starting from bright yellow (TD 1 = start of trend) to dark red (TD 13 = trend exhausted)
// Bearish colors are starting from bright blue (TD 1 = start of trend) to dark blue (TD 13 = trend exhausted)
//
// DeMark recommends to be used for short term price reversals only but as you can see in the chart, it also works for LUNA 1D chart.
// Also works very well with Heikin Ashi candles.
// Use it in combination with for example the "Tom DeMark Pressure Ratio" to find tops and bottoms.
// You can change the timeframes, disable lables/barcolor and customise colors to your liking.
//
// If you have any idea on how to optimise the code, please feel free to share :)
//
// Inspired by "Stochastic Heat Map" from @Violent
//
////////////////////////////////////////////////////////////////////////////////////////////////////////////////////////////

//@version=5
indicator(title='Tom DeMark Sequential Heat Map', shorttitle='TD heatmap', overlay=true, timeframe='')
//A heat map for TD counts. If you find this useful or yank the code, please consider a donation :)

// -------- Inputs --------
paintBars = input(title='Paint Bars', defval=true)
showLabels = input(title='Show labels', defval=true)

buy_col = input(#32CD32,0,'Colors',inline='col')
sell_col = input(#F44336,0,'',inline='col')
text_col = input(#FFFFFF,0,'',inline='col')


// -------- Bearish trend (blue) color selection --------
getBuyColor(count) =>
    if count == 1
        color.new(#11e7f2,0)
    else
        if count == 2
            color.new(#11d9f2,0)
        else
            if count == 3
                color.new(#11cbf2,0)
            else
                if count == 4
                    color.new(#11aff2,0)
                else
                    if count == 5
                        color.new(#1193f2,0)
                    else
                        if count == 6
                            color.new(#1176f2,0)
                        else
                            if count == 7
                                color.new(#105df4,0)
                            else
                                if count == 8
                                    color.new(#1051f5,0)
                                else
                                    if count == 9
                                        color.new(#0f44f5,0)
                                    else
                                        if count == 10
                                            color.new(#0c3de0,0)
                                        else
                                            if count == 11
                                                color.new(#0935ca,0)
                                            else
                                                if count == 12
                                                    color.new(#062eb4,0)
                                                else
                                                    if count == 13
                                                        color.new(#02269e,0)

// -------- Bullish trend (blue) color selection --------
getSellColor(count) =>
    if count == 1
        color.new(#eef211,0)
    else
        if count == 2
            color.new(#efdc11,0)
        else
            if count == 3
                color.new(#f0c511,0)
            else
                if count == 4
                    color.new(#f1af11,0)
                else
                    if count == 5
                        color.new(#f29811,0)
                    else
                        if count == 6
                            color.new(#f28811,0)
                        else
                            if count == 7
                                color.new(#f27811,0)
                            else
                                if count == 8
                                    color.new(#f26811,0)
                                else
                                    if count == 9
                                        color.new(#f25811,0)
                                    else
                                        if count == 10
                                            color.new(#ea420d,0)
                                        else
                                            if count == 11
                                                color.new(#e12c09,0)
                                            else
                                                if count == 12
                                                    color.new(#d81605,0)
                                                else
                                                    if count == 13
                                                        color.new(#cf0000,0)

// -------- Calculate bearish trend sequence --------
buySetup = 0
buySetup := close < close[4] ? buySetup[1] == 13 ? 1 : buySetup[1] + 1 : 0


// -------- Calculate bullish trend sequence --------
sellSetup = 0
sellSetup := close > close[4] ? sellSetup[1] == 13 ? 1 : sellSetup[1] + 1 : 0


// -------- Paint bars --------
barColour = buySetup >= 1 ? getBuyColor(buySetup) : sellSetup >= 1 ? getSellColor(sellSetup) : na
//barcolor(paintBars ? barColour : na, title='Bar colors (heatmap)')


if buySetup == 13
    strategy.entry("Enter Long", strategy.long)
else if sellSetup == 13
    strategy.entry("Enter Short", strategy.short)
- Tendência linear
- Padrão de tempo de Fibonacci
- Tendência pivô
- Super tendência B
- Linha KijunSen com Cruz
- Tendência do diamante
- Impulso 2.0
- Tendência Heikin-Ashi
- Pontos de reversão de Demark
- Uma linha uniforme Demo de tendências
- RSI MTF Ob+Os
- Estratégia MACD Willy
- RSI - Sinais de compra e venda
- Tendência Heikin-Ashi
- HA Viés de mercado
- Oscilador suave de nuvem de Ichimoku
- Williams %R - Suavizado
- QQE MOD + SSL híbrido + Waddah Attar Explosão
- Comprar/Vender Strat
- Triple Supertrend com EMA e ADX
- jma + dwma por multigranos
- MACD mágico
- Pontuação Z com sinais
- Estratégias de fluctuação simples do Python
- 3EMA + Boullinger + PIVOT
- Baguete por multigranos
- Máquina de milhares
- Indicador de inversão de K I
- Velas engolindo
- MA Imperador insicliconot