Estratégia de negociação de média móvel exponencial tripla e média móvel exponencial estocástica
Visão geral
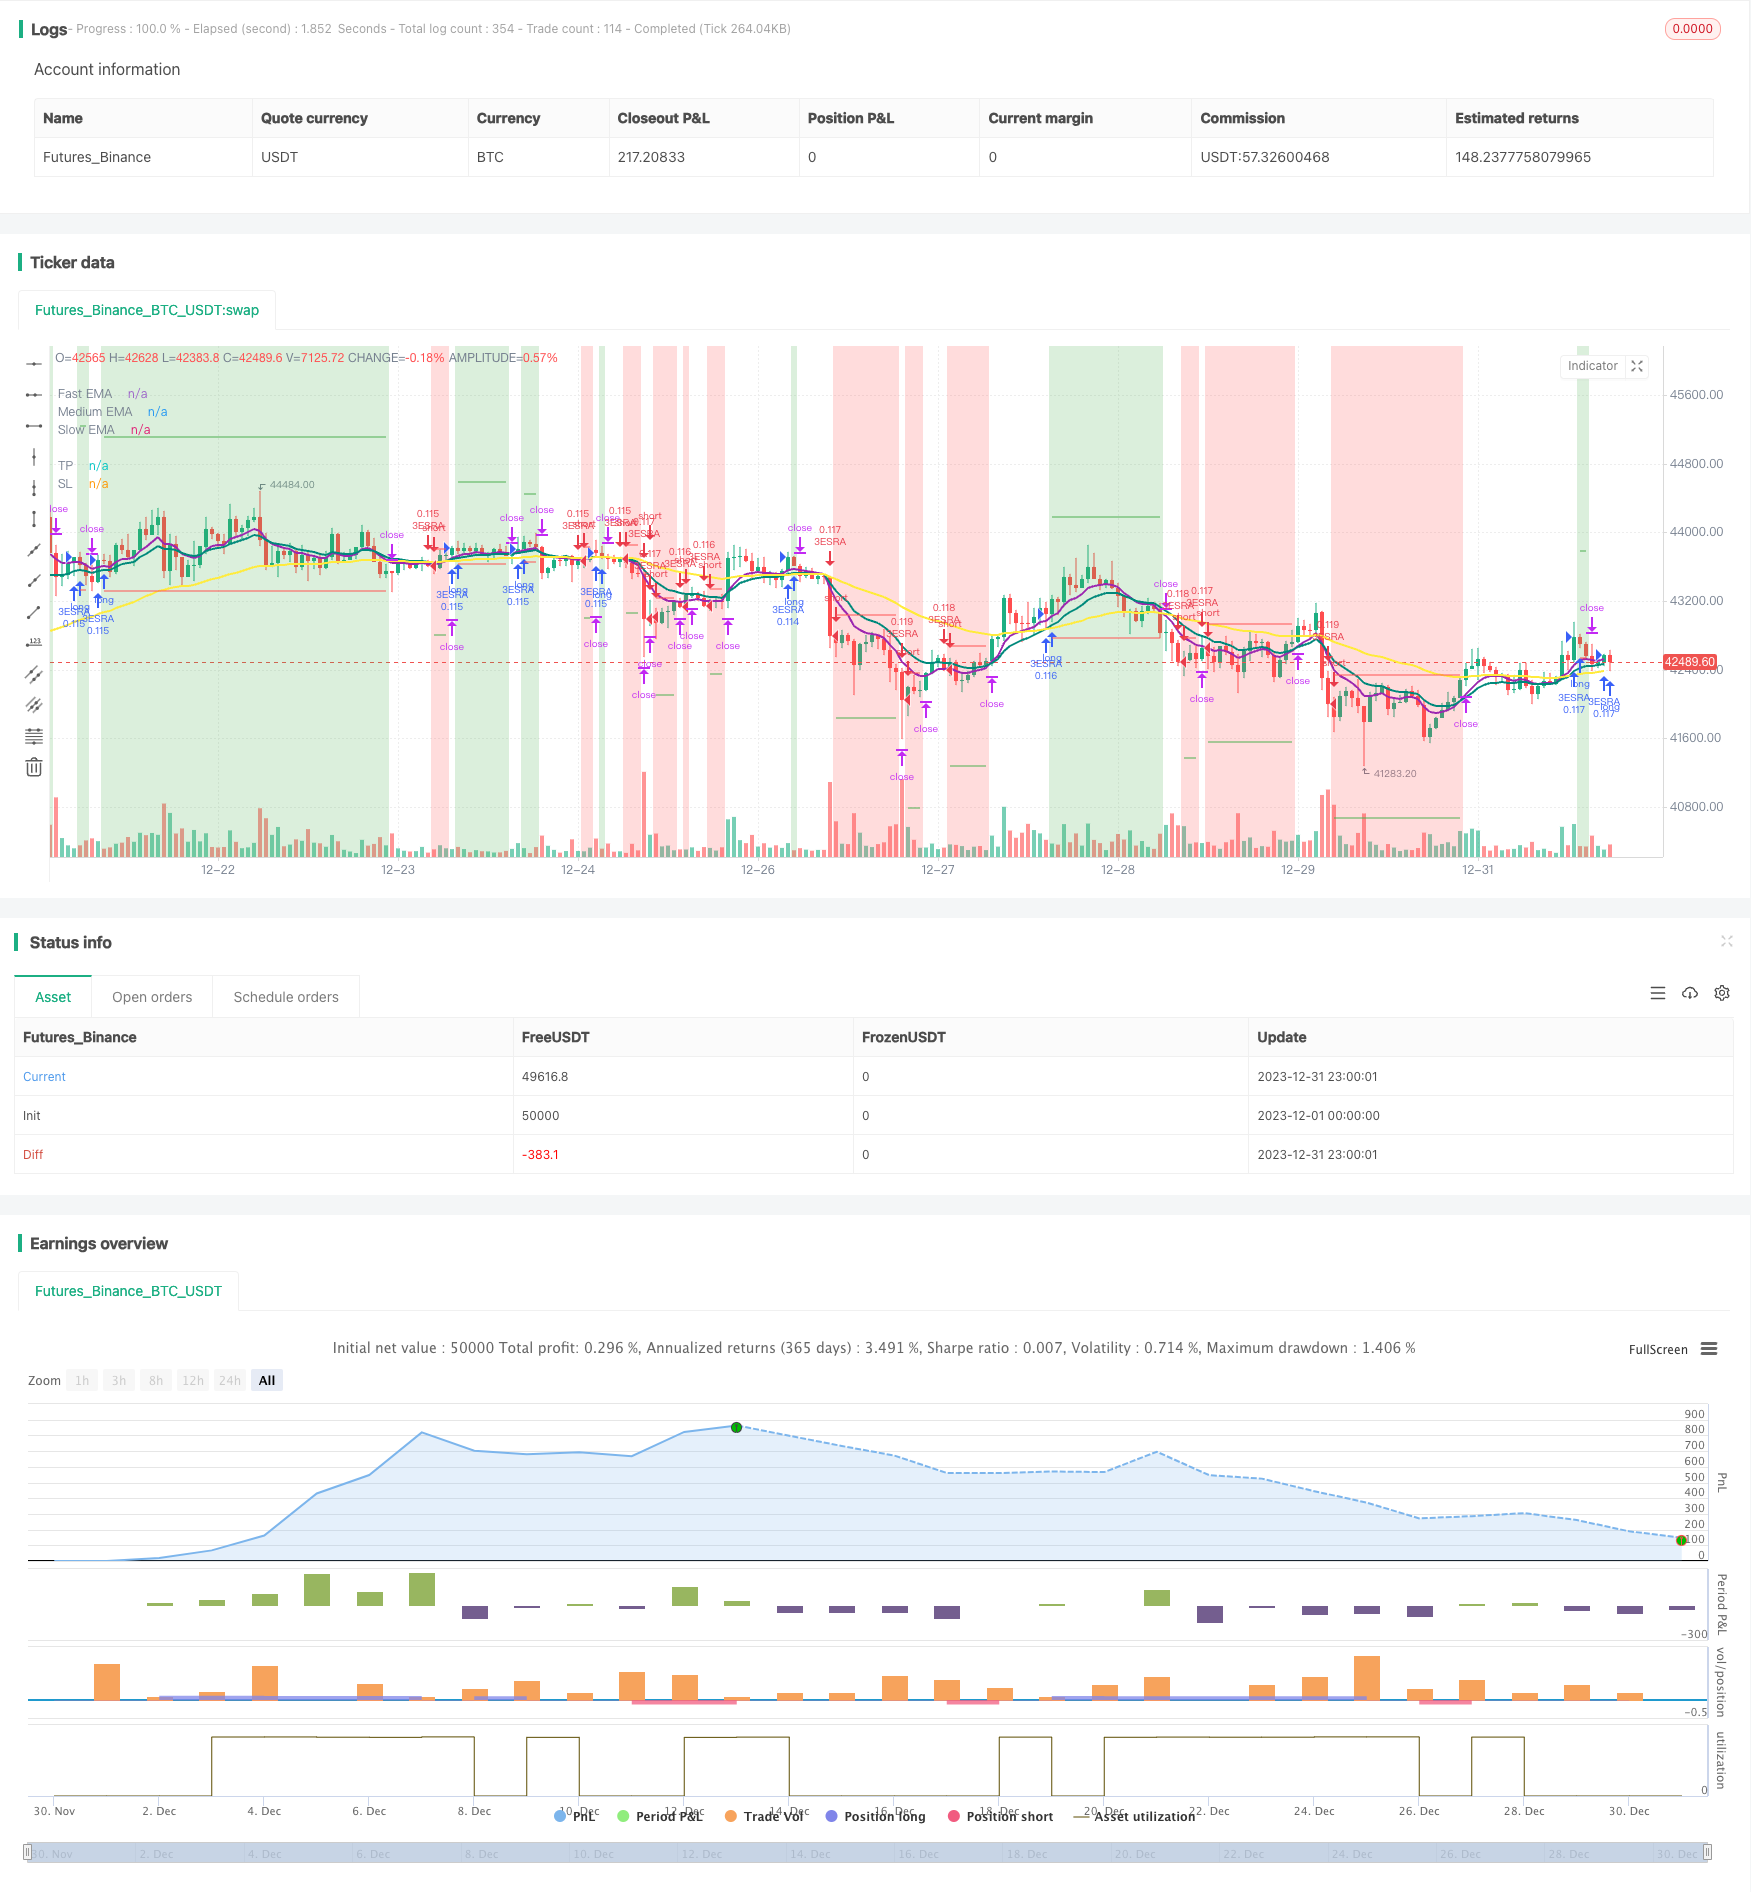
A estratégia é uma estratégia de acompanhamento de tendências que combina um indicador de média móvel de índice triplo com um indicador de média móvel de índice aleatório para gerar um sinal de negociação. Quando a média móvel rápida é atravessada pela média móvel rápida, a média móvel média é vista mais quando atravessa a média móvel lenta; Quando a média móvel rápida é atravessada pela média móvel rápida, a média móvel baixa é vista menos quando atravessa a média móvel rápida.
Princípios
Usando a média móvel tripla de 8, 14 e 50 dias. Quando a média móvel de 8 dias é atravessada pela média móvel de 14 dias, um sinal de leitura múltipla é gerado quando a média móvel de 14 dias é atravessada pela média móvel de 50 dias; ao contrário, um sinal de leitura de olho.
Usar um indicador de média móvel lisinha de índice aleatório ((Stochastic RSI) como um indicador de julgamento auxiliar. Especificamente: primeiro, calcule o RSI de 14 dias, em seguida, calcule o indicador estocástico com base no indicador de RSI, e, finalmente, calcule o indicador estocástico para obter a linha K e a linha D.
Ao gerar um sinal de negociação, se o preço estiver acima da média móvel do índice de 8 dias, a entrada é mais; se o preço estiver abaixo da média móvel do índice de 8 dias, a entrada é vazia.
O stop loss está localizado abaixo/acima de 1x o ATR. O stop loss está localizado acima/abaixo de 4x o ATR.
Vantagens
A média móvel, como um indicador básico, pode acompanhar de forma eficaz as tendências do mercado. A média móvel tripla é usada em combinação com vários períodos, garantindo simultaneamente a sensibilidade às tendências de curto e médio prazo.
A adição do RSI estocástico como um indicador de julgamento auxiliar, pode filtrar os falsos sinais e melhorar a precisão da entrada.
De acordo com o ATR para definir a posição de parada de perda, você pode acompanhar dinamicamente a volatilidade do mercado, evitando que a parada de perda seja muito grande ou muito pequena.
A estratégia tem uma configuração de parâmetros razoável e é ideal para grandes tendências. A retracção é pequena e os ganhos são mais estáveis, adequados para operações de linha longa.
Riscos
A estratégia de combinação de múltiplos indicadores aumenta o risco de reversão. Quando a média móvel e o RSI estocástico emitem sinais opostos, pode ocorrer um erro de sinal de negociação.
Os parâmetros de stop loss e stop loss são mais conservadores, podendo ser rompidos em situações de forte volatilidade, perdendo a oportunidade de tendência. Nesse caso, é possível ajustar adequadamente o parâmetro ATR ou aumentar o múltiplo do stop loss.
Devido ao uso de uma média móvel tripla, há um certo atraso quando a linha rápida e a linha de velocidade média se revertem. É necessário prestar atenção se o preço se reverteu para decidir se entrar ou não.
Esta estratégia é principalmente adequada para situações de tendência que não funcionam bem em situações de consolidação. Neste caso, pode-se considerar otimizar os parâmetros periódicos das médias móveis ou usar outros indicadores de determinação.
Otimização
Pode-se considerar a inclusão de outros indicadores, como o MACD, para otimizar ainda mais o tempo de entrada. Também pode-se testar combinações de médias móveis de diferentes parâmetros.
Pode-se otimizar os parâmetros da verificação ATR. Por exemplo, ajuste o stop loss de 1 ATR para 1.5 ATR e o stop loss de 4 ATR para 3 ATR para ver se pode obter melhores resultados.
Pode-se testar usando apenas a média móvel, removendo o indicador Stochastic RSI, para ver se é possível filtrar mais ruído e obter ganhos mais estáveis.
Pode-se considerar a adição de mais condições para julgar a tendência, como o aumento do volume de transações para garantir a operação em grandes tendências.
Resumir
A estratégia combina o uso de médias móveis de índice triplo e o indicador Stochastic RSI para determinar a direção da tendência. O sinal de entrada é mais rigoroso e pode efetivamente reduzir a negociação sem sentido. A configuração de stop loss segue a dinâmica ATR, tornando os parâmetros da estratégia auto-adaptáveis.
/*backtest
start: 2023-12-01 00:00:00
end: 2023-12-31 23:59:59
period: 1h
basePeriod: 15m
exchanges: [{"eid":"Futures_Binance","currency":"BTC_USDT"}]
*/

//              3ESRA
//              v0.2a

// Coded by Vaida Bogdan

// 3ESRA consists of a 3 EMA cross + a close above (for longs) the quickest EMA
// or below (for shorts). Note that I've deactivated the RSI Cross Over/Under
// (you can modify the code and activate it). The strategy also uses a stop loss
// that's at 1 ATR distance from the entry price and a take profit that's at
// 4 times the ATR distance from the entry price.

// Feedback:
// Tested BTCUSDT Daily
// 1. Stoch-RSI makes you miss opportunities.
// 2. Changing RR to 4:1 times ATR works better.

//@version=4
strategy(title="3 EMA + Stochastic RSI + ATR", shorttitle="3ESRA", overlay=true, pyramiding=1,
     process_orders_on_close=true, calc_on_every_tick=true,
     initial_capital=1000, currency = currency.USD, default_qty_value=10,
     default_qty_type=strategy.percent_of_equity,
     commission_type=strategy.commission.percent, commission_value=0.1, slippage=2)

startDate = input(title="Start Date", type=input.integer,
     defval=1, minval=1, maxval=31, group="Backtesting range")
startMonth = input(title="Start Month", type=input.integer,
     defval=1, minval=1, maxval=12, group="Backtesting range")
startYear = input(title="Start Year", type=input.integer,
     defval=1900, minval=1800, maxval=2100, group="Backtesting range")
endDate = input(title="End Date", type=input.integer,
     defval=1, minval=1, maxval=31, group="Backtesting range")
endMonth = input(title="End Month", type=input.integer,
     defval=1, minval=1, maxval=12, group="Backtesting range")
endYear = input(title="End Year", type=input.integer,
     defval=2040, minval=1800, maxval=2100, group="Backtesting range")

// Date range filtering
inDateRange = (time >= timestamp(syminfo.timezone, startYear, startMonth, startDate, 0, 0)) and
     (time < timestamp(syminfo.timezone, endYear, endMonth, endDate, 23, 59))

fast = input(8, minval=8, title="Fast EMA", group="EMAs")
medium = input(14, minval=8, title="Medium EMA", group="EMAs")
slow = input(50, minval=8, title="Slow EMA", group="EMAs")
src = input(close, title="Source")

smoothK = input(3, "K", minval=1, group="Stoch-RSI", inline="K&D")
smoothD = input(3, "D", minval=1, group="Stoch-RSI", inline="K&D")
lengthRSI = input(14, "RSI Length", minval=1, group="Stoch-RSI", inline="length")
lengthStoch = input(14, "Stochastic Length", minval=1, group="Stoch-RSI", inline="length")
rsiSrc = input(close, title="RSI Source", group="Stoch-RSI")

length = input(title="Length", defval=14, minval=1, group="ATR")
smoothing = input(title="Smoothing", defval="RMA", options=["RMA", "SMA", "EMA", "WMA"], group="ATR")

// EMAs
fastema = ema(src, fast)
mediumema = ema(src, medium)
slowema = ema(src, slow)

// S-RSI
rsi1 = rsi(rsiSrc, lengthRSI)
k = sma(stoch(rsi1, rsi1, rsi1, lengthStoch), smoothK)
d = sma(k, smoothD)
sRsiCrossOver = k[1] < d[1] and k > d
sRsiCrossUnder = k[1] > d[1] and k < d

// ATR
ma_function(source, length) =>
	if smoothing == "RMA"
		rma(source, length)
	else
		if smoothing == "SMA"
			sma(source, length)
		else
			if smoothing == "EMA"
				ema(source, length)
			else
				wma(source, length)
atr = ma_function(tr(true), length)

// Trading Logic
longCond1 = (fastema > mediumema) and (mediumema > slowema)
longCond2 = true
// longCond2 = sRsiCrossOver
longCond3 = close > fastema
longCond4 = strategy.position_size <= 0
longCond = longCond1 and longCond2 and longCond3 and longCond4 and inDateRange

shortCond1 = (fastema < mediumema) and (mediumema < slowema)
shortCond2 = true
// shortCond2 = sRsiCrossUnder
shortCond3 = close < fastema
shortCond4 = strategy.position_size >= 0
shortCond = shortCond1 and shortCond2 and shortCond3 and shortCond4 and inDateRange

var takeProfit = float(na), var stopLoss = float(na)
if longCond and strategy.position_size <= 0
    takeProfit := close + 4*atr
    stopLoss := close - 1*atr
    // takeProfit := close + 2*atr
    // stopLoss := close - 3*atr

else if shortCond and strategy.position_size >= 0
    takeProfit := close - 4*atr
    stopLoss := close + 1*atr
    // takeProfit := close - 2*atr
    // stopLoss := close + 3*atr

// Strategy calls
strategy.entry("3ESRA", strategy.long, comment="Long", when=longCond and strategy.position_size <= 0)
strategy.entry("3ESRA", strategy.short, comment="Short", when=shortCond and strategy.position_size >= 0)
strategy.exit(id="TP-SL", from_entry="3ESRA", limit=takeProfit, stop=stopLoss)
if (not inDateRange)
    strategy.close_all()

// Plot EMAs
plot(fastema, color=color.purple, linewidth=2, title="Fast EMA")
plot(mediumema, color=color.teal, linewidth=2, title="Medium EMA")
plot(slowema, color=color.yellow, linewidth=2, title="Slow EMA")
// Plot S-RSI
// plotshape((strategy.position_size > 0) ? na : sRsiCrossOver, title="StochRSI Cross Over", style=shape.triangleup, location=location.belowbar, color=color.teal, text="SRSI", size=size.small)
// Plot trade
bgcolor(strategy.position_size > 0 ? color.new(color.green, 75) : strategy.position_size < 0 ? color.new(color.red,75) : color(na))
// Plot Strategy
plot((strategy.position_size != 0) ? takeProfit : na, style=plot.style_linebr, color=color.green, title="TP")
plot((strategy.position_size != 0) ? stopLoss : na, style=plot.style_linebr, color=color.red, title="SL")