اشارے: WaveTrend Oscillator
مصنف:چاؤ ژانگ، تاریخ: 2022-05-06 18:40:27ٹیگز:ای ایم اےایس ایم اے
ویو ٹرینڈ اوسیلیٹر ایک مشہور ٹی ایس / ایم ٹی اشارے کا پورٹ ہے۔ جب اوسیلیٹر اوور بکڈ بینڈ (سرخ لائنیں) سے اوپر ہوتا ہے اور سگنل (ڈاٹ لائن) کو نیچے سے عبور کرتا ہے تو ، یہ عام طور پر ایک اچھا فروخت کا سگنل ہوتا ہے۔ اسی طرح ، جب اوسیلیٹر اوور سیل بینڈ (گرین لائنیں) سے نیچے ہوتے وقت سگنل سے اوپر ہوتا ہے تو ، یہ ایک اچھا خرید کا سگنل ہوتا ہے۔
میں نے مندرجہ بالا چارٹ میں کچھ کراس اوور نشان لگا دیا ہے۔ جیسا کہ آپ دیکھ سکتے ہیں، وہ ہیںنہیںصرف مفید سگنل WT پیدا کرتا ہے. اپنے آلے پر اس کی کوشش کریں اور مجھے بتائیں کہ آپ کیا سوچتے ہیں.
دوبارہ جانچ پڑتال
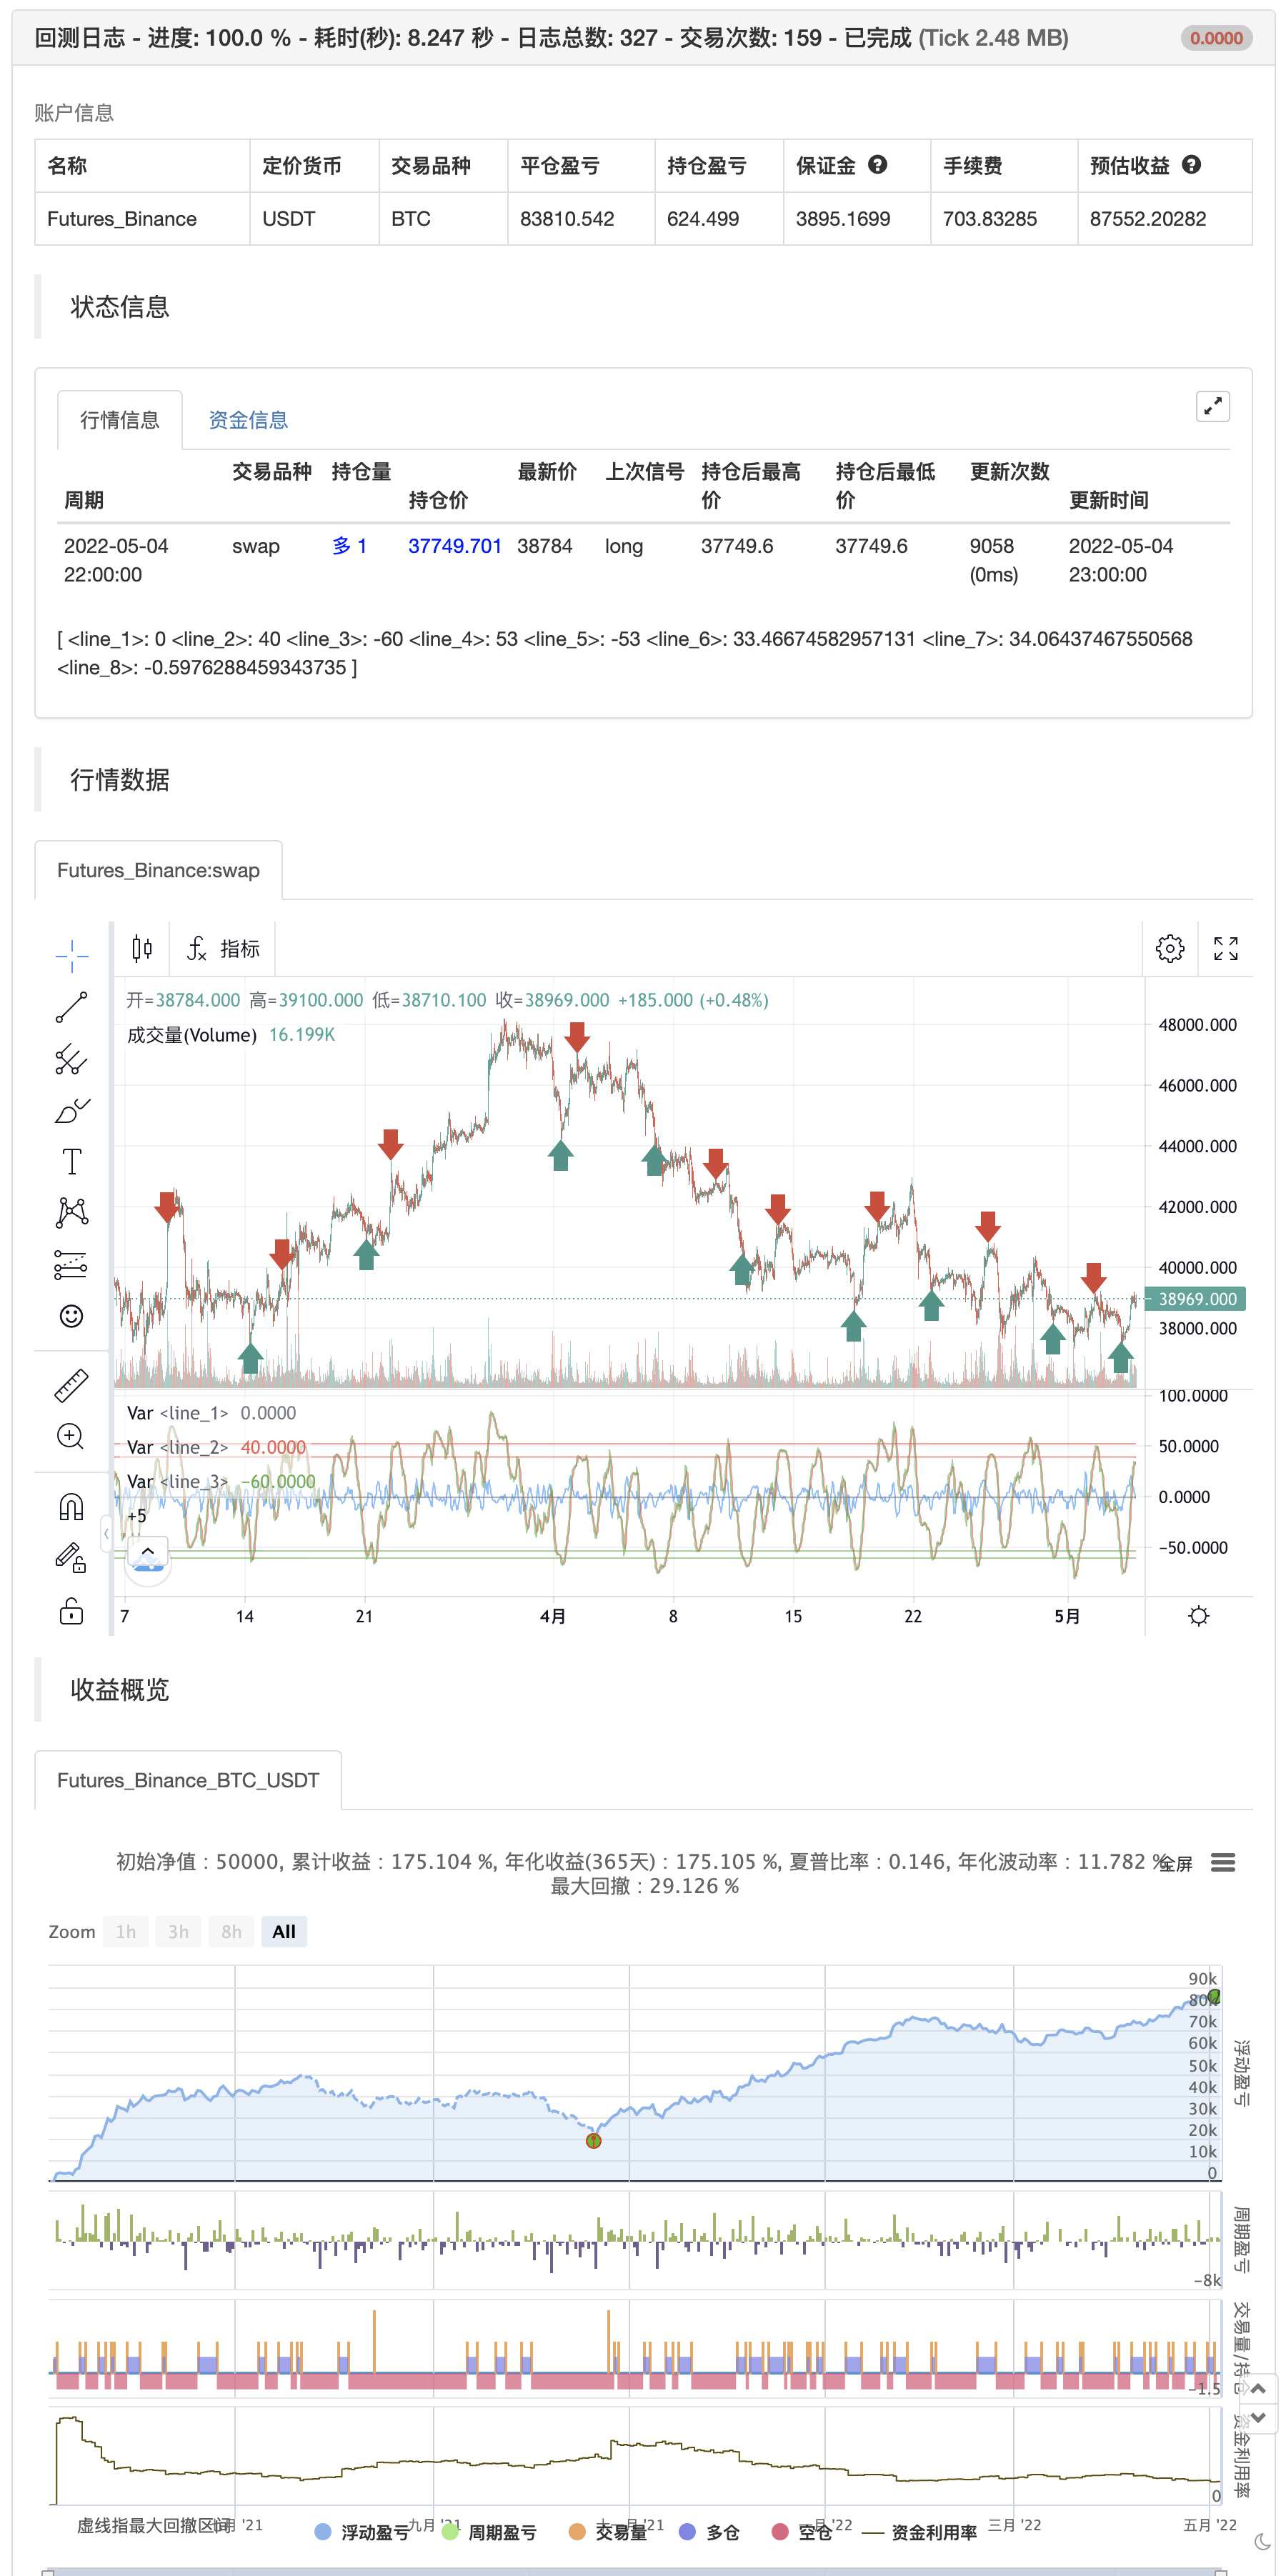
/*backtest
start: 2021-05-05 00:00:00
end: 2022-05-04 23:59:00
period: 1h
basePeriod: 15m
exchanges: [{"eid":"Futures_Binance","currency":"BTC_USDT"}]
args: [["v_input_3",40]]
*/

//
// @author LazyBear
//
// If you use this code in its original/modified form, do drop me a note.
//
study(title="WaveTrend [LazyBear]", shorttitle="WT_LB")
n1 = input(10, "Channel Length")
n2 = input(21, "Average Length")
obLevel1 = input(60, "Over Bought Level 1")
obLevel2 = input(53, "Over Bought Level 2")
osLevel1 = input(-60, "Over Sold Level 1")
osLevel2 = input(-53, "Over Sold Level 2")

ap = hlc3
esa = ta.ema(ap, n1)
d = ta.ema(math.abs(ap - esa), n1)
ci = (ap - esa) / (0.015 * d)
tci = ta.ema(ci, n2)

wt1 = tci
wt2 = ta.sma(wt1,4)

plot(0, color=color.gray)
plot(obLevel1, color=color.red)
plot(osLevel1, color=color.green)
plot(obLevel2, color=color.red, style=3)
plot(osLevel2, color=color.green, style=3)

plot(wt1, color=color.green)
plot(wt2, color=color.red, style=3)
plot(wt1-wt2, color=color.blue, transp=80)
if wt1 >obLevel1
    strategy.entry("entry short", strategy.short)
else if wt1 < osLevel1
    strategy.entry("entry long", strategy.long)
متعلقہ
- ایس ایس ایل چینل
- اے ایم اے سی ڈی - تمام متحرک اوسط کنورجنس ڈائیورجنس
- ٹریڈنگ اے بی سی
- ہیل-4 ایما
- بولنگر زبردست الرٹ R1
- HALFTREND + HEMA + SMA (غلط سگنل کی حکمت عملی)
- چلتی اوسط کراس الرٹ، ملٹی ٹائم فریم (MTF)
- QQE MOD + ایس ایس ایل ہائبرڈ + ودہ اتار دھماکہ
- ایم ایل انتباہات کا نمونہ
- چلتی اوسط اور بولنگر بینڈ پر مبنی مقداری تجارتی حکمت عملی
مزید
- سپر ٹرینڈ
- سوئنگ ہائٹس/لوز اور موم بتی پیٹرن
- ٹی ایم اے اوورلے
- ایم اے سی ڈی + ایس ایم اے 200 حکمت عملی
- سی ایم سلنگ شاٹ سسٹم
- بولنگر + آر ایس آئی، ڈبل حکمت عملی v1.1
- بولنگر بینڈ کی حکمت عملی
- بہتر ٹرینڈ ٹریکر
- پائن اسکرپٹ کی حکمت عملیوں میں ماہانہ واپسی
- v4 کے لئے ADX اور DI
- میک ڈی اپنی مرضی کے مطابق اشارے-متعدد ٹائم فریم + تمام دستیاب اختیارات!
- دباؤ رفتار اشارے
- الفا ٹرینڈ
- متعدد ٹائم فریم ٹریڈنگ
- جذبات آکسیلیٹر
- کرنسی اور کرنسی کے جوڑے کی تجارت کرنسی کی نقد رقم کے لئے استعمال کیا جاتا ہے تاکہ مارکیٹ کی قیمت کو صاف کیا جاسکے۔
- کچھیوں کی حکمت عملی
- اپنے رجحان کو حاصل کریں
- الفا ٹرینڈ استعمال ایم ایف آئی
- ڈیجیٹل کرنسیوں کے لئے نئی حکمت عملی (تعلیم)