پییوٹ پوائنٹ سپر ٹرینڈ
مصنف:چاؤ ژانگ، تاریخ: 2022-05-17 15:45:37ٹیگز:محوراے ٹی آر
ہیلو سب،
بہت ساری قسم کے سپر ٹرینڈ موجود ہیں۔ حال ہی میں میں نے محور پوائنٹس پر مبنی سپر ٹرینڈ کے بارے میں سوچا پھر میں نے
اس اسکرپٹ کے پیچھے خیال محور پوائنٹس تلاش کرنا ہے ، ان کا اوسط حساب لگانا اور سپر ٹرینڈ کی طرح اے ٹی آر کے ذریعہ اعلی / نچلے بینڈ بنانا ہے۔ جیسا کہ آپ الگورتھم میں دیکھ سکتے ہیں اسکرپٹ ماضی کے محور پوائنٹس کو وزن دیتا ہے ، یہ تھوڑا سا ہموار کرنے کے لئے کیا جاتا ہے۔
بیک ٹسٹ
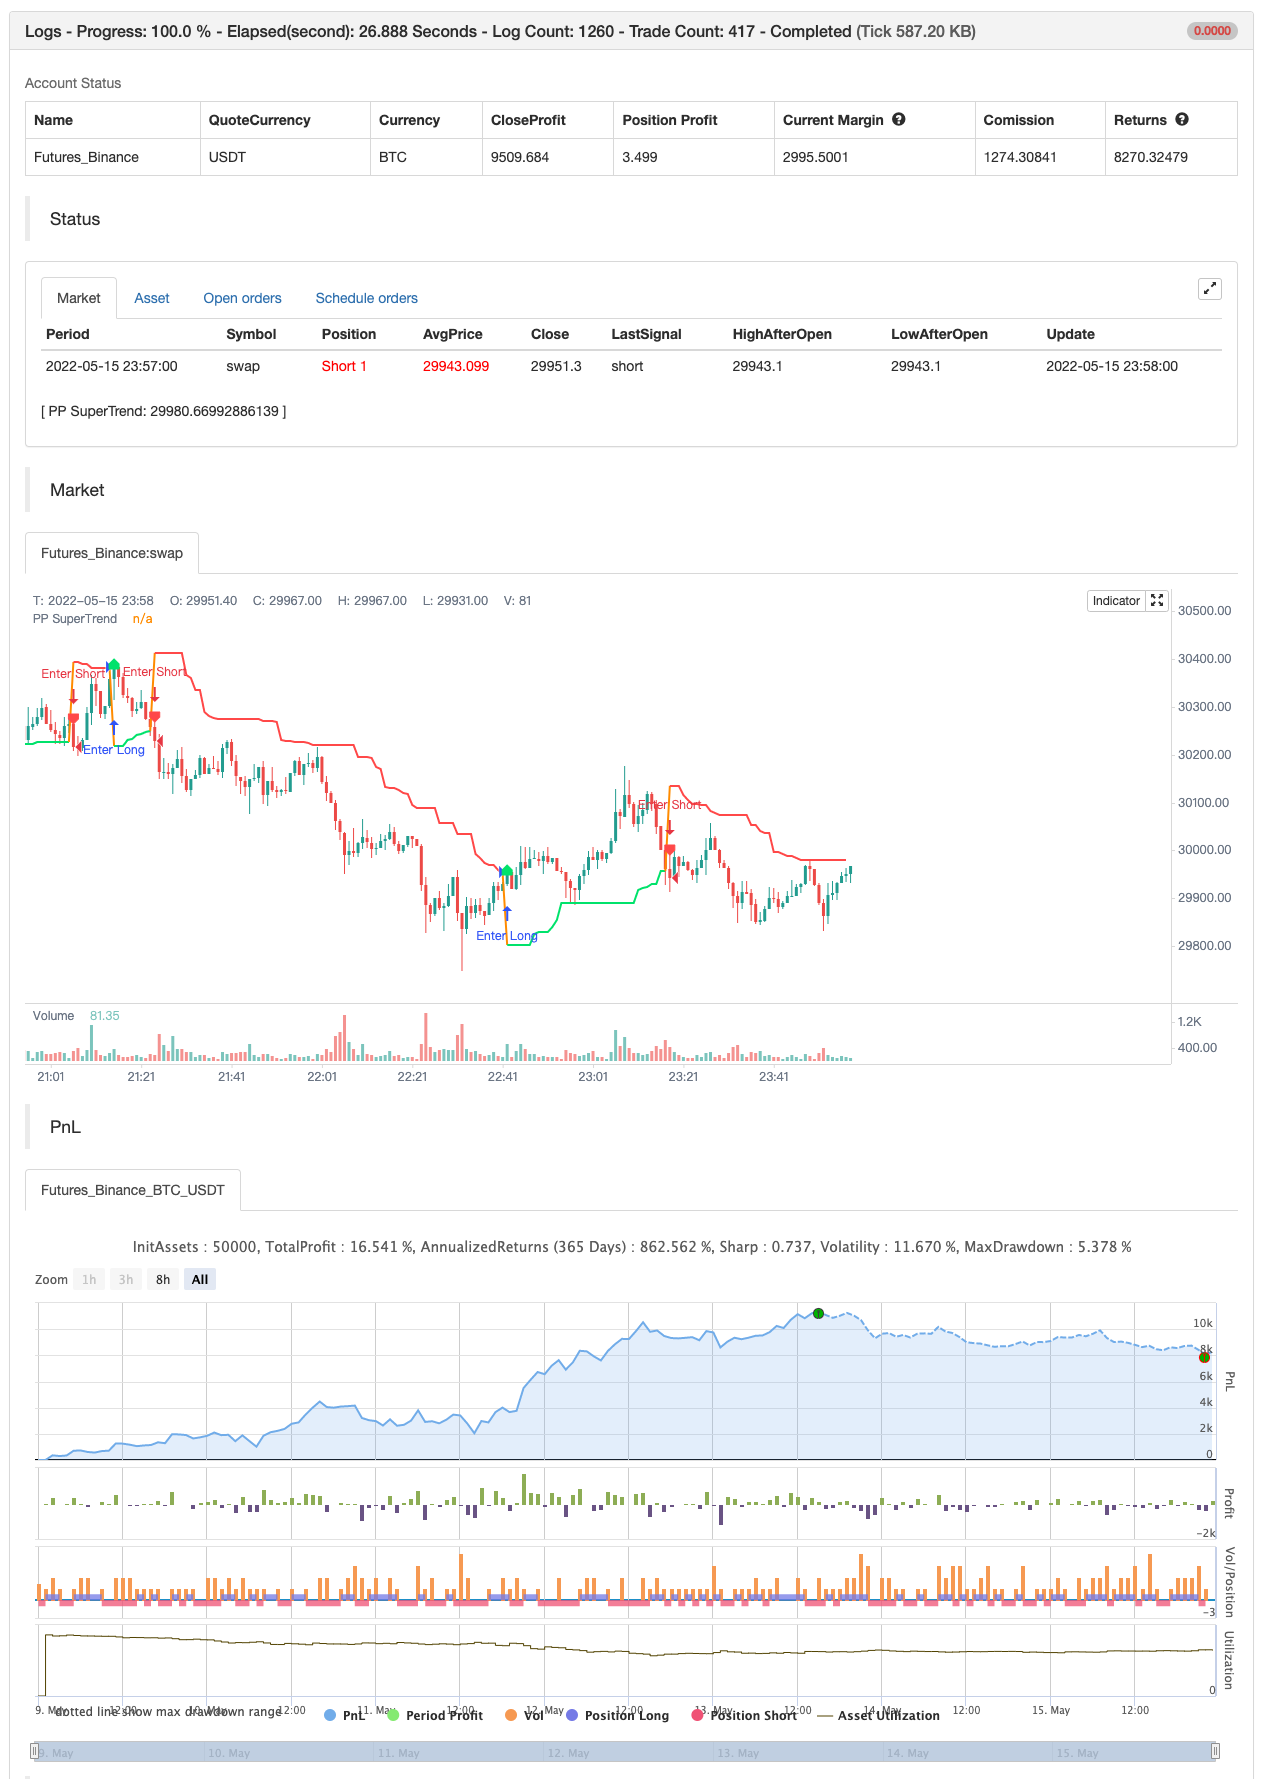
/*backtest
start: 2022-05-09 00:00:00
end: 2022-05-15 23:59:00
period: 1m
basePeriod: 1m
exchanges: [{"eid":"Futures_Binance","currency":"BTC_USDT"}]
*/

// This source code is subject to the terms of the Mozilla Public License 2.0 at https://mozilla.org/MPL/2.0/
// © LonesomeTheBlue

//@version=4
study("Pivot Point SuperTrend", overlay = true)
prd = input(defval = 3, title="Pivot Point Period", minval = 1, maxval = 50)
Factor=input(defval = 2, title = "ATR Factor", minval = 1, step = 0.1)
Pd=input(defval = 6, title = "ATR Period", minval=1)
showpivot = input(defval = false, title="Show Pivot Points")
showlabel = input(defval = true, title="Show Buy/Sell Labels")
showcl = input(defval = false, title="Show PP Center Line")
showsr = input(defval = false, title="Show Support/Resistance")

// get Pivot High/Low
float ph = pivothigh(prd, prd)
float pl = pivotlow(prd, prd)

// drawl Pivot Points if "showpivot" is enabled
plotshape(ph and showpivot, text="H",  style=shape.labeldown, color=na, textcolor=color.red, location=location.abovebar, transp=0, offset = -prd)
plotshape(pl and showpivot, text="L",  style=shape.labeldown, color=na, textcolor=color.lime, location=location.belowbar, transp=0, offset = -prd)

// calculate the Center line using pivot points
var float center = na
float lastpp = ph ? ph : pl ? pl : na
if lastpp
    if na(center)
        center := lastpp
    else
        //weighted calculation
        center := (center * 2 + lastpp) / 3

// upper/lower bands calculation
Up = center - (Factor * atr(Pd))
Dn = center + (Factor * atr(Pd))

// get the trend
float TUp = na
float TDown = na
Trend = 0
TUp := close[1] > TUp[1] ? max(Up, TUp[1]) : Up
TDown := close[1] < TDown[1] ? min(Dn, TDown[1]) : Dn
Trend := close > TDown[1] ? 1: close < TUp[1]? -1: nz(Trend[1], 1)
Trailingsl = Trend == 1 ? TUp : TDown

// plot the trend
linecolor = Trend == 1 and nz(Trend[1]) == 1 ? color.lime : Trend == -1 and nz(Trend[1]) == -1 ? color.red : na
plot(Trailingsl, color = linecolor ,  linewidth = 2, title = "PP SuperTrend")

plot(showcl ? center : na, color = showcl ? center < hl2 ? color.blue : color.red : na)

// check and plot the signals
bsignal = Trend == 1 and Trend[1] == -1
ssignal = Trend == -1 and Trend[1] == 1
plotshape(bsignal and showlabel ? Trailingsl : na, title="Buy", text="Buy", location = location.absolute, style = shape.labelup, size = size.tiny, color = color.lime, textcolor = color.black, transp = 0)
plotshape(ssignal and showlabel ? Trailingsl : na, title="Sell", text="Sell", location = location.absolute, style = shape.labeldown, size = size.tiny, color = color.red, textcolor = color.white, transp = 0)

//get S/R levels using Pivot Points
float resistance = na
float support = na
support := pl ? pl : support[1]
resistance := ph ? ph : resistance[1]

// if enabled then show S/R levels
plot(showsr and support ? support : na, color = showsr and support ? color.lime : na, style = plot.style_circles, offset = -prd)
plot(showsr and resistance ? resistance : na, color = showsr and resistance ? color.red : na, style = plot.style_circles, offset = -prd)

// alerts
alertcondition(Trend == 1 and Trend[1] == -1, title='Buy Signal', message='Buy Signal')
alertcondition(Trend == -1 and Trend[1] == 1, title='Sell Signal', message='Sell Signal')
alertcondition(change(Trend), title='Trend Changed', message='Trend Changed')


if Trend == 1 and Trend[1] == -1
    strategy.entry("Enter Long", strategy.long)
else if Trend == -1 and Trend[1] == 1
    strategy.entry("Enter Short", strategy.short)
متعلقہ
- وِلا ڈائنامک پِیوٹ سپر ٹرینڈ حکمت عملی
- وقفے کے ساتھ فبونیکی ترقی
- کثیر اناج کی طرف سے بیگیٹ
- SUPERTREND ATR کے ساتھ ٹریلنگ سٹاپ نقصان
- میل مشین
- لوڈشیلڈر باہر نکلیں
- الفا ٹرینڈ استعمال ایم ایف آئی
- محور آرڈر بلاکس
- پییوٹ پوائنٹس اعلی کم ملٹی ٹائم فریم
- پییوٹ پر مبنی ٹریلنگ زیادہ سے زیادہ اور کم سے کم
مزید
- ریڈ کے حجم تیز رفتار سمت توانائی کا تناسب
- Donchian بریک آؤٹ کوئی repaint
- ریڈ کے مومنٹم بارز
- سپر جمپ ٹرن بیک بولنگر بینڈ
- فوکوز رجحان
- جانی کی BOT
- ایس ایس ایل ہائبرڈ
- لوڈشیلڈر باہر نکلیں
- ریسوٹو
- ای ایم اے کلاؤڈ انٹرا ڈے حکمت عملی
- سپر ٹرینڈ+4متحرک
- رفتار پر مبنی زگ زگ
- VuManChu Cipher B + Divergences حکمت عملی
- تصور دوہری سپر ٹرینڈ
- سپر اسکیلپر
- بیک ٹسٹنگ- اشارے
- ٹرینڈیلیوس
- ایس ایم اے بی ٹی سی قاتل
- ایم ایل انتباہات کا نمونہ
- وقفے کے ساتھ فبونیکی ترقی