فوکوز رجحان
مصنف:چاؤ ژانگ، تاریخ: 2022-05-18 10:25:47ٹیگز:آر ایم اےآر ایس آئی
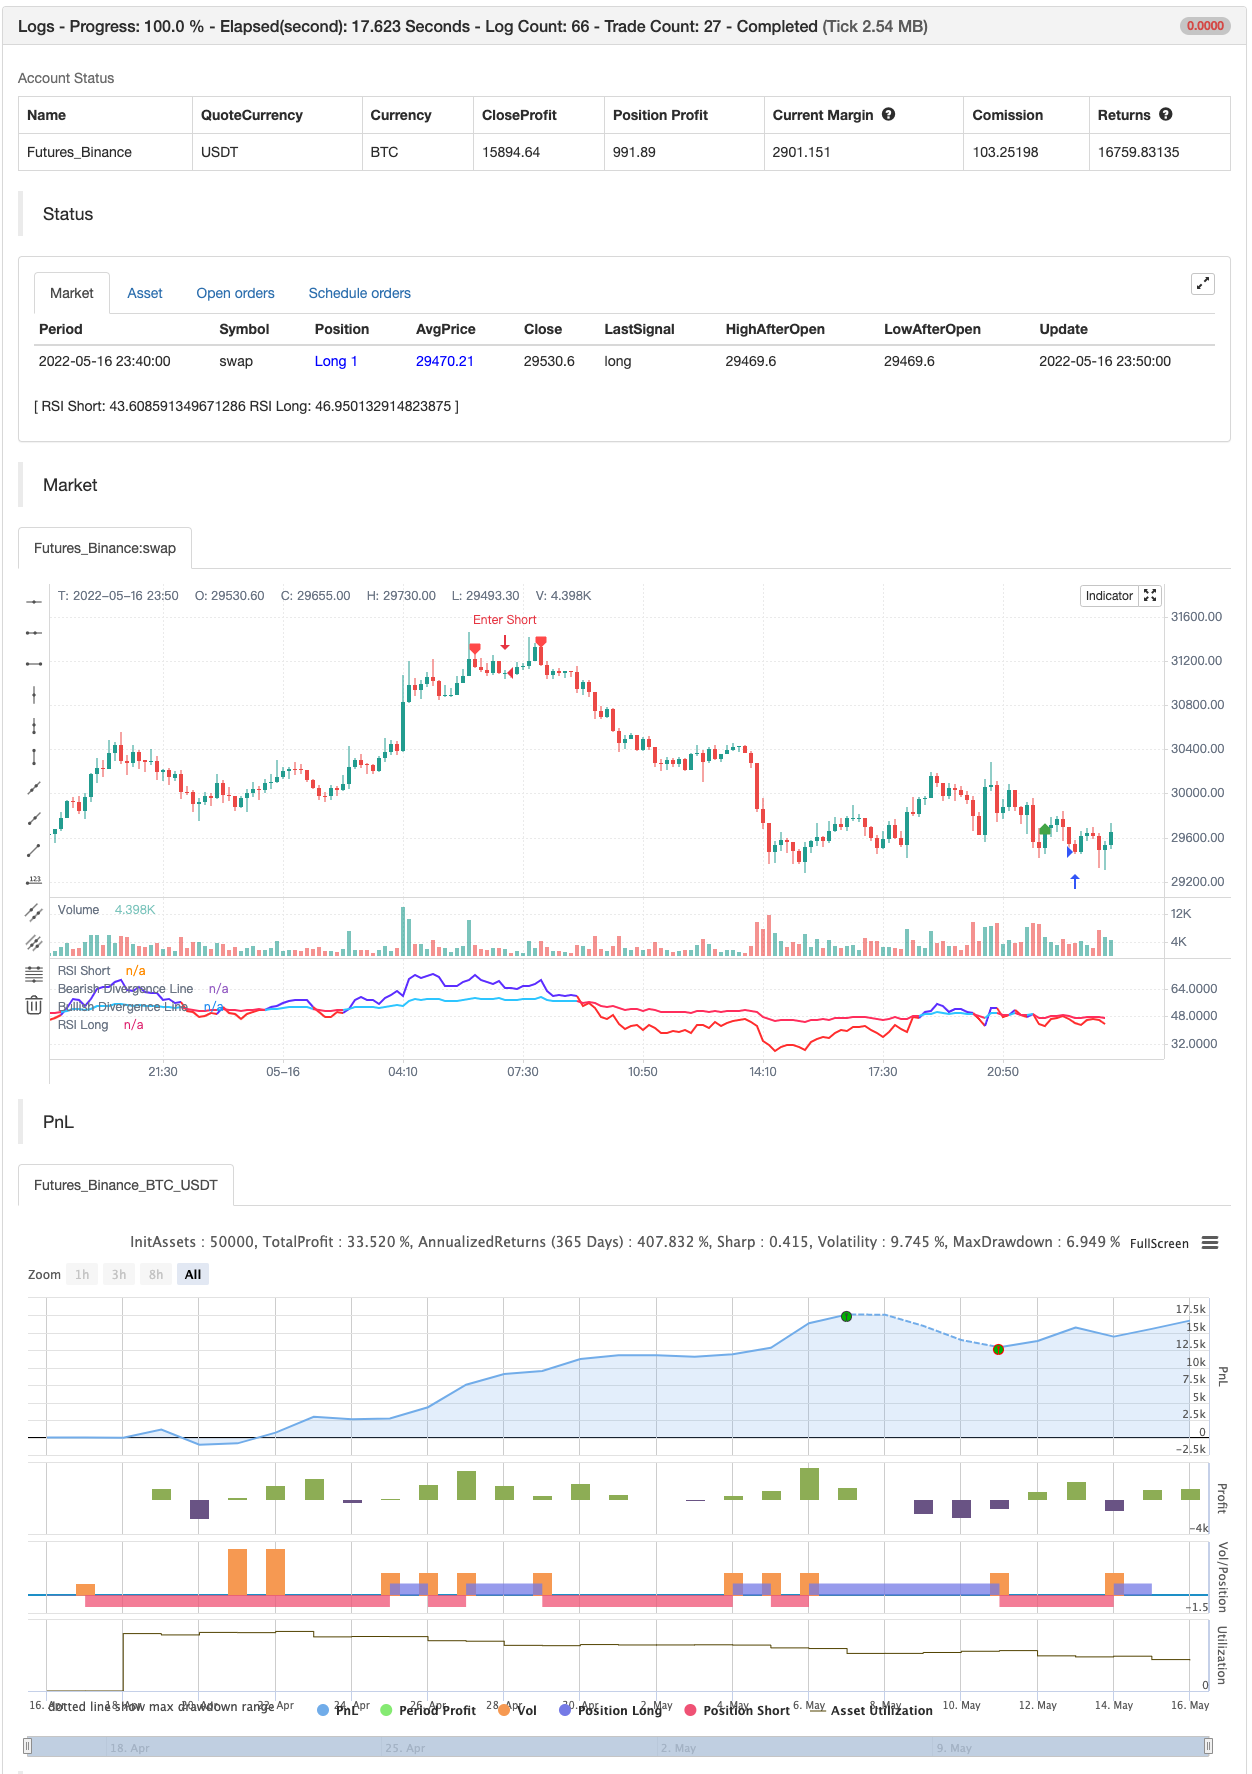
یہ اشارے 2 مختلف ادوار کے RSI پر مبنی ہے۔
# ایک مختصر تعارف RSI #
رشتہ دار طاقت کا اشاریہ (آر ایس آئی) ایک رفتار کا اشارے ہے جو تکنیکی تجزیہ میں استعمال ہوتا ہے جو اسٹاک یا دیگر اثاثوں کی قیمت میں زیادہ خریدنے یا زیادہ فروخت ہونے والے حالات کا اندازہ کرنے کے لئے حالیہ قیمتوں میں ہونے والی تبدیلیوں کی شدت کی پیمائش کرتا ہے۔ آر ایس آئی ایک آسکیلیٹر (ایک لائن گراف جو دو انتہا کے درمیان چلتا ہے) کے طور پر دکھایا جاتا ہے اور اس کی پڑھنے کی حد 0 سے 100 تک ہوسکتی ہے۔ یہ اشارے اصل میں جے ویلس وائلڈر جونیئر نے تیار کیا تھا اور 1978 کی اپنی کتاب میں متعارف کرایا گیا تھا ،
آر ایس آئی کی روایتی ترجمانی اور استعمال یہ ہے کہ 70 یا اس سے زیادہ کی اقدار اس بات کی نشاندہی کرتی ہیں کہ ایک سیکیورٹی زیادہ سے زیادہ خریدی جارہی ہے یا اس کی قیمت زیادہ ہے اور اس کی قیمت میں رجحان کی تبدیلی یا اصلاحی پل بیک کے لئے تیار کیا جاسکتا ہے۔ 30 یا اس سے کم آر ایس آئی پڑھنے سے زیادہ فروخت یا کم قیمت کی حالت ظاہر ہوتی ہے۔
# اس اشارے میں # میں دیکھ رہا ہوں کہ آپ دو RSI مختلف ادوار کے ساتھ استعمال کر سکتے ہیں ۔
# مختصر اور طویل RSI کراسنگ کے درمیان حالات # کراس اوور = تیزی کا رجحان (نیلا زون) کراس انڈر = bearish رجحان (سرخ زون)
بیک ٹسٹنگ
/*backtest
start: 2022-04-17 00:00:00
end: 2022-05-16 23:59:00
period: 10m
basePeriod: 1m
exchanges: [{"eid":"Futures_Binance","currency":"BTC_USDT"}]
*/

//@version=5
//Fukuiz
indicator(title='Fukuiz Trend', shorttitle='Fukuiz Trend', format=format.price, precision=2, timeframe='')

//color//
colorwhite = #FFFFFF
colorblue = #6633FF
colorred = #FF3333
colorblue2 = #33CCFF
colorpink = #FF3366

//Fuction//
len = input.int(24, minval=1, title='RSI Short')
len2 = input.int(100, minval=1, title='RSI Long')
src = input(open, 'Source')
up = ta.rma(math.max(ta.change(src), 0), len)
down = ta.rma(-math.min(ta.change(src), 0), len)
up2 = ta.rma(math.max(ta.change(src), 0), len2)
down2 = ta.rma(-math.min(ta.change(src), 0), len2)
rsi = down == 0 ? 100 : up == 0 ? 0 : 100 - 100 / (1 + up / down)
rsi2 = down2 == 0 ? 100 : up2 == 0 ? 0 : 100 - 100 / (1 + up2 / down2)

Bullish = rsi > rsi2
Bearish = rsi < rsi2
Fukuizcolor = Bullish ? color.new(colorblue,0) : Bearish ? color.new(colorred,0) : na
Fukuizcolor2 = Bullish ? color.new(colorblue2,0) : Bearish ? color.new(colorpink,0) : na
Fukuizcolor3 = Bullish ? color.new(colorblue,75) : Bearish ? color.new(colorred,75) : na

//Plot//
l1 = plot(rsi, 'RSI Short', color=Fukuizcolor, linewidth=2, style=plot.style_line)
l2 = plot(rsi2, 'RSI Long', color=Fukuizcolor2, linewidth=2, style=plot.style_line)
band2 = hline(50, 'Middle Band', color=#FFCC99)
band1 = hline(70, 'Upper Band', color=#FFCC99)
band0 = hline(30, 'Lower Band', color=#FFCC99)
fill(band1, band0, color.new(#0946CA, 90), title='Background')
fill(l1, l2, color=Fukuizcolor3, title='Trend Background')


//DIVERGENCE//
lbR = input(title='Pivot Lookback Right', defval=5)
lbL = input(title='Pivot Lookback Left', defval=5)
rangeUpper = input(title='Max of Lookback Range', defval=60)
rangeLower = input(title='Min of Lookback Range', defval=5)
plotBull = input(title='Bullish Divergence', defval=true)
plotBear = input(title='Bearish Divergence', defval=true)
bearColor = color.red
bullColor = color.green
hiddenBullColor = color.new(color.green, 80)
hiddenBearColor = color.new(color.red, 80)
textColor = color.white
noneColor = color.new(color.white, 100)
osc = ta.rsi(src, len)

plFound = na(ta.pivotlow(osc, lbL, lbR)) ? false : true
phFound = na(ta.pivothigh(osc, lbL, lbR)) ? false : true
_inRange(cond) =>
    bars = ta.barssince(cond == true)
    rangeLower <= bars and bars <= rangeUpper

oscHL = osc[lbR] > ta.valuewhen(plFound, osc[lbR], 1) and _inRange(plFound[1])
priceLL = low[lbR] < ta.valuewhen(plFound, low[lbR], 1)
bullCond = plotBull and priceLL and oscHL and plFound

plot(plFound ? osc[lbR] : na, offset=-lbR, title='Bullish Divergence Line', linewidth=2, color=bullCond ? bullColor : noneColor,display=display.none)

plotshape(bullCond ? osc[lbR] : na, offset=-lbR, title='Bullish Divergence Label', text=' Bull ', style=shape.labelup, location=location.absolute, color=color.new(bullColor, 0), textcolor=color.new(textColor, 0))

oscLH = osc[lbR] < ta.valuewhen(phFound, osc[lbR], 1) and _inRange(phFound[1])
priceHH = high[lbR] > ta.valuewhen(phFound, high[lbR], 1)
bearCond = plotBear and priceHH and oscLH and phFound

plot(phFound ? osc[lbR] : na, offset=-lbR, title='Bearish Divergence Line', linewidth=2, color=bearCond ? bearColor : noneColor,display=display.none)

plotshape(bearCond ? osc[lbR] : na, offset=-lbR, title='Bearish Divergence Label', text=' Bear ', style=shape.labeldown, location=location.absolute, color=color.new(bearColor, 0), textcolor=color.new(textColor, 0))


if bullCond
    strategy.entry("Enter Long", strategy.long)
else if bearCond
    strategy.entry("Enter Short", strategy.short)
- سپر اسکیلپر - 5 منٹ 15 منٹ
- خرید/فروخت کے ساتھ EMA ADX RSI کا اسکیلپنگ
- آر ایس آئی - خرید فروخت سگنل
- RSI شماریاتی سودے بازی کی حکمت عملی
- آر ایس آئی رلیٹیو طاقت انڈیکس حکمت عملی
- zdmre کی طرف سے RSI
- RSI MTF Ob+Os
- ٹی ایم اے-لیگیسی
- سپر ٹریکس
- بولنگر + آر ایس آئی، ڈبل حکمت عملی v1.1
- CM MACD کسٹم اشارے - متعدد ٹائم فریم - V2
- ہول لائن
- 2 حرکت پذیر اوسط رنگ سمت کا پتہ لگانے
- اسکیلپنگ پل بیک ٹول R1
- خرید و فروخت کی حکمت عملی AO+Stoch+RSI+ATR پر منحصر ہے
- ای ایم اے ٹرینڈ کلاؤڈ
- ریڈ کے حجم تیز رفتار سمت توانائی کا تناسب
- Donchian بریک آؤٹ کوئی repaint
- ریڈ کے مومنٹم بارز
- سپر جمپ ٹرن بیک بولنگر بینڈ
- جانی کی BOT
- ایس ایس ایل ہائبرڈ
- لوڈشیلڈر باہر نکلیں
- ریسوٹو
- ای ایم اے کلاؤڈ انٹرا ڈے حکمت عملی
- پییوٹ پوائنٹ سپر ٹرینڈ
- سپر ٹرینڈ+4متحرک
- رفتار پر مبنی زگ زگ
- VuManChu Cipher B + Divergences حکمت عملی
- تصور دوہری سپر ٹرینڈ