ریڈ کے حجم تیز رفتار سمت توانائی کا تناسب
مصنف:چاؤ ژانگ، تاریخ: 2022-05-18 15:21:57ٹیگز:ای ایم اےایس ایم اےڈبلیو ایم اے
حجم تیز رفتار سمتی توانائی کا تناسب (VADER) منظر کے پیچھے مثبت (خریداری) اور منفی (فروخت)
VADER کیسے کام کرتا ہے؟
میں ہمیشہ تکنیکی تجزیہ کے تصورات کا پرستار رہا ہوں جو سادہ ہیں، اور جو قیمت کی کارروائی اور حجم دونوں کو ایک ساتھ ضم کرتے ہیں - ویڈر کے پیچھے تصور واقعی ایک سادہ ہے.
آئیے اس کے ذریعے چلتے ہیں کیونکہ ہم بہت تکنیکی ہونے سے بچتے ہیں:
بڑی مقدار سے وابستہ بڑی قیمتوں میں تبدیلی کا مطلب یہ ہے کہ خریدار (اگر حرکت اوپر ہے) یا بیچنے والے (جب حرکت نیچے ہے) سنجیدہ ہیں اور
VADER کے ساتھ مماثلت یہ ہے کہ ہم قیمت کی نقل و حرکت (دو باروں کے درمیان بند ہونے کی تبدیلی) کو نقل و حرکت (یا کارروائی کا نتیجہ) اور اس سے وابستہ حجم کو اس کارروائی کے پیچھے
پھر ہم ہر سمت میں اس رشتہ دار توانائی کا اوسط لیتے ہیں (مثبت = خریدنے اور منفی = فروخت) اور خالص توانائی کا حساب لگاتے ہیں.
نوٹ کریں کہ ہم یہاں تجارت کے نقطہ نظر سے تشبیہ کے قریب آ رہے ہیں اور طبیعیات کے نقطہ نظر سے نہیں:)
بیک ٹسٹ
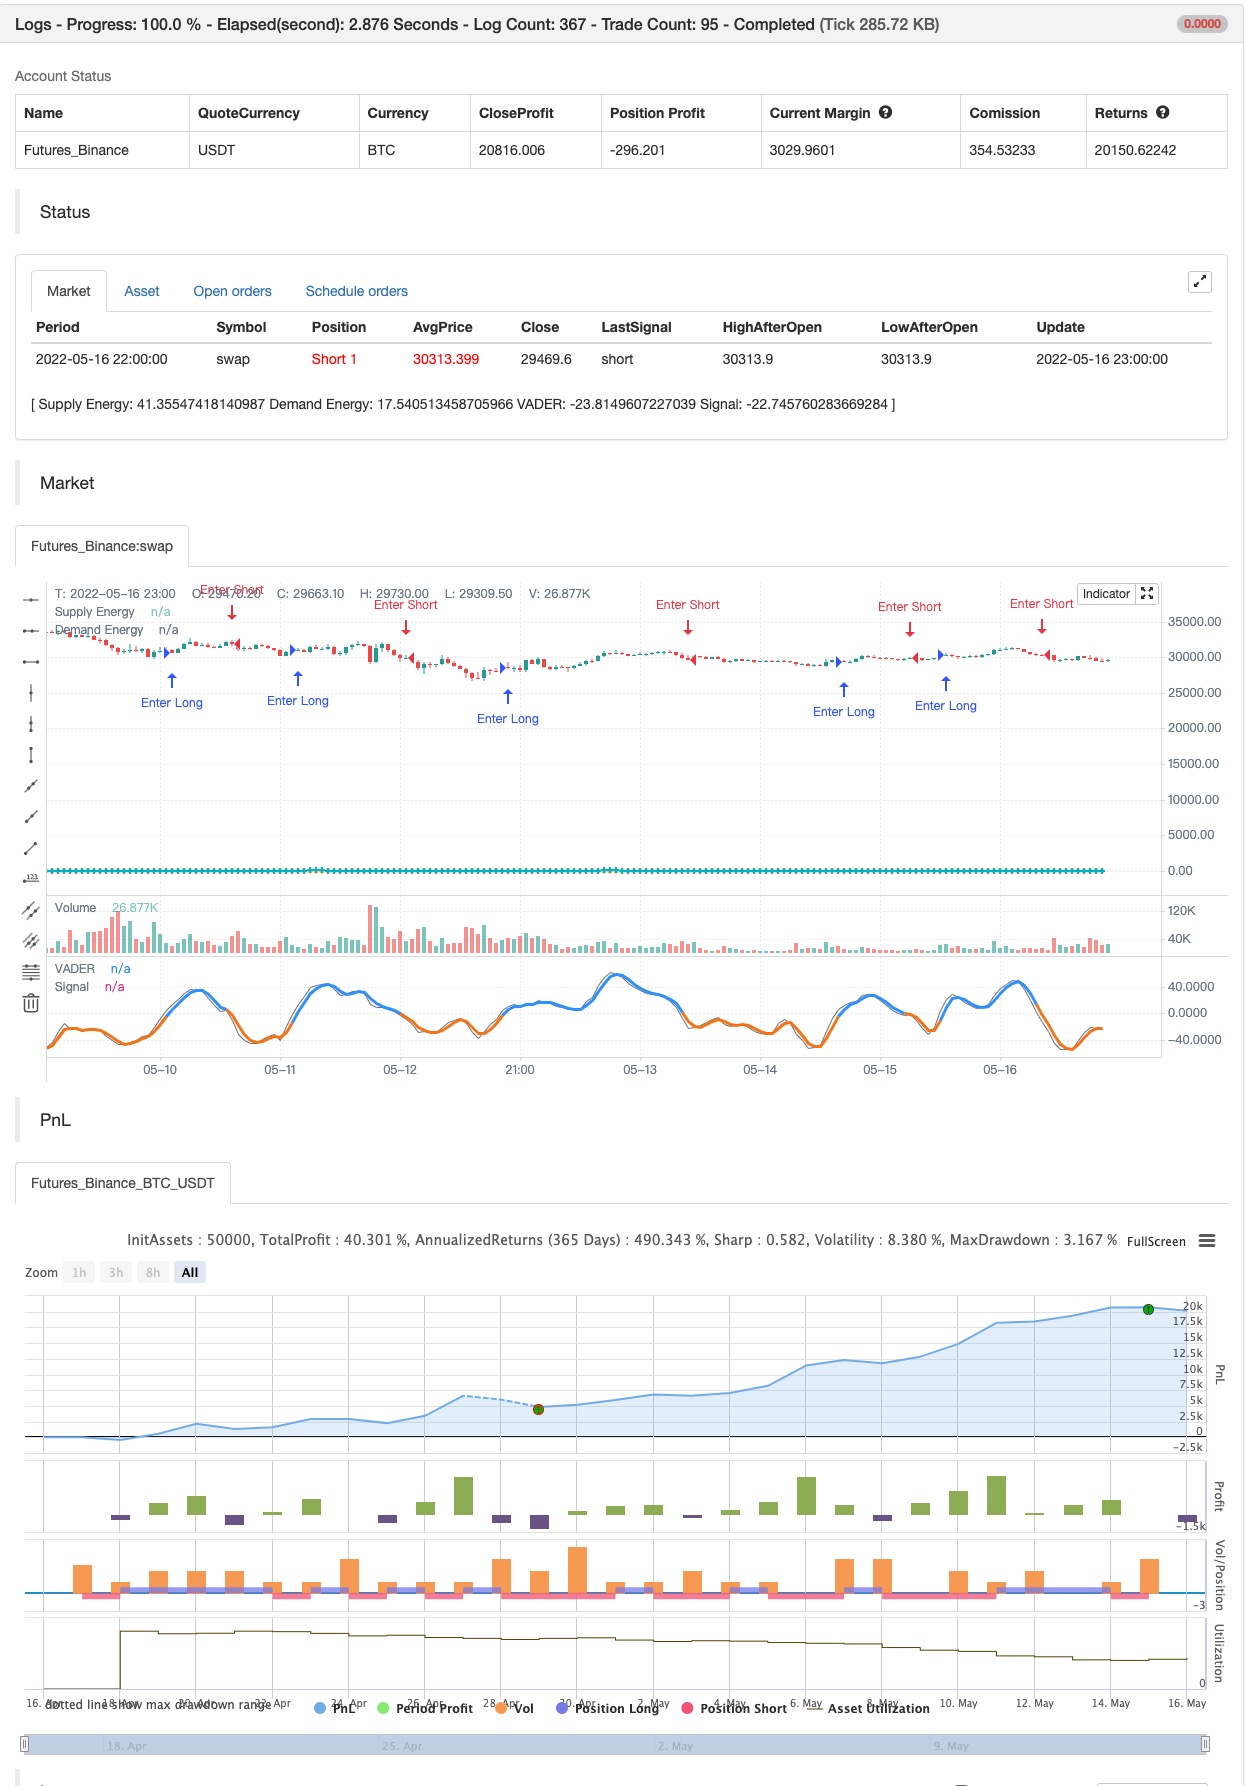
/*backtest
start: 2022-04-17 00:00:00
end: 2022-05-16 23:59:00
period: 1h
basePeriod: 15m
exchanges: [{"eid":"Futures_Binance","currency":"BTC_USDT"}]
*/

// This source code is subject to the terms of the Mozilla Public License 2.0 at https://mozilla.org/MPL/2.0/
// © RedKTrader

//@version=5
indicator('RedK Volume-Accelerated Directional Energy Ratio', 'RedK VADER v3.0', precision=0, timeframe='', timeframe_gaps=false)

// ***********************************************************************************************************
// Choose volume calculation method.. Relative vs full.
// Relative magnifies effect of recent volume spikes (up or down)
f_RelVol(_value, _length) =>
    min_value = ta.lowest(_value, _length)
    max_value = ta.highest(_value, _length)
    ta.stoch(_value, max_value, min_value, _length) / 100
// ***********************************************************************************************************

// ***********************************************************************************************************
// Choose MA type for the base DER calculation ..
// WMA is my preference and is default .. SMA is really slow and lags a lot - but added for comparison
f_derma(_data, _len, MAOption) =>
    value =
      MAOption == 'SMA' ? ta.sma(_data, _len) :
      MAOption == 'EMA' ? ta.ema(_data, _len) :
      ta.wma(_data, _len)
// ***********************************************************************************************************


// ===========================================================================================================
//      Inputs
// ===========================================================================================================

price   = close
length  = input.int(9, minval=1)
DER_avg = input.int(5, 'Average', minval=1, inline='DER', group='Directional Energy Ratio')
MA_Type = input.string('WMA', 'DER MA type', options=['WMA', 'EMA', 'SMA'], inline='DER', group='Directional Energy Ratio')
smooth  = input.int(3, 'Smooth', minval=1,  inline='DER_1', group='Directional Energy Ratio')

show_senti = input.bool(false, 'Sentiment',  inline='DER_s', group='Directional Energy Ratio')
senti   = input.int(20, 'Length', minval=1, inline='DER_s', group='Directional Energy Ratio')


v_calc  = input.string('Relative', 'Calculation', options=['Relative', 'Full', 'None'], group='Volume Parameters')
vlookbk = input.int(10, 'Lookback (for Relative)', minval=1,                            group='Volume Parameters')

// ===========================================================================================================
//          Calculations
// ===========================================================================================================

// Volume Calculation Option  -- will revert to no volume acceleration for instruments with no volume data
vola    =
  v_calc == 'None' or na(volume) ? 1 :
  v_calc == 'Relative' ? f_RelVol(volume, vlookbk) :
  volume

R       = (ta.highest(2) - ta.lowest(2)) / 2                    // R is the 2-bar average bar range - this method accomodates bar gaps
sr      = ta.change(price) / R                                  // calc ratio of change to R
rsr     = math.max(math.min(sr, 1), -1)                         // ensure ratio is restricted to +1/-1 in case of big moves
c       = fixnan(rsr * vola)                                    // add volume accel -- fixnan adresses cases where no price change between bars

c_plus  = math.max(c, 0)                                        // calc directional vol-accel energy
c_minus = -math.min(c, 0)

// plot(c_plus)
// plot(c_minus)


avg_vola    = f_derma(vola, length, MA_Type)
dem         = f_derma(c_plus, length, MA_Type)  / avg_vola          // directional energy ratio
sup         = f_derma(c_minus, length, MA_Type) / avg_vola

adp         = 100 * ta.wma(dem, DER_avg)                            // average DER
asp         = 100 * ta.wma(sup, DER_avg)
anp         = adp - asp                                             // net DER..
anp_s       = ta.wma(anp, smooth)

// Calculate Sentiment - a VADER for a longer period and can act as a baseline (compared to a static 0 value)
// note we're not re-calculating vol_avg, demand or supply energy for sentiment. this would've been a different approach
s_adp       = 100 * ta.wma(dem, senti)                            // average DER for sentiment length
s_asp       = 100 * ta.wma(sup, senti)
V_senti     = ta.wma(s_adp - s_asp, smooth)


// ===========================================================================================================
//      Colors & plots
// ===========================================================================================================
c_adp   = color.new(color.aqua, 30)
c_asp   = color.new(color.orange, 30)
c_fd    = color.new(color.green, 80)
c_fs    = color.new(color.red, 80)
c_zero  = color.new(#ffee00, 70)

c_up    = color.new(#359bfc, 0)
c_dn    = color.new(#f57f17, 0)

c_sup   = color.new(#33ff00, 80)
c_sdn   = color.new(#ff1111, 80)
up      = anp_s >= 0
s_up    = V_senti >=0

hline(0, 'Zero Line', c_zero, hline.style_solid)

// =============================================================================
// v3.0 --- Sentiment will be represented as a 4-color histogram
c_grow_above = #1b5e2080
c_grow_below = #dc4c4a80
c_fall_above = #66bb6a80
c_fall_below = #ef8e9880

sflag_up = math.abs(V_senti) >= math.abs(V_senti[1])

plot(show_senti ? V_senti : na, "Sentiment", style=plot.style_columns,
 color = s_up ? (sflag_up ? c_grow_above : c_fall_above) :
 sflag_up ? c_grow_below : c_fall_below)
// =============================================================================

s = plot(asp, 'Supply Energy', c_asp, 2, style=plot.style_circles,  join=true)
d = plot(adp, 'Demand Energy', c_adp, 2, style=plot.style_cross,    join=true)
fill(d, s, adp > asp ? c_fd : c_fs)

plot(anp, 'VADER', color.new(color.gray, 30), display=display.none)
plot(anp_s, 'Signal', up ? c_up : c_dn, 3)

// ===========================================================================================================
//      v2.0 adding alerts
// ===========================================================================================================

Alert_up    = ta.crossover(anp_s,0)
Alert_dn    = ta.crossunder(anp_s,0)
Alert_swing = ta.cross(anp_s,0)

// "." in alert title for the alerts to show in the right order up/down/swing
alertcondition(Alert_up,    ".   VADER Crossing 0 Up",      "VADER Up - Buying Energy Detected!")
alertcondition(Alert_dn,    "..  VADER Crossing 0 Down",    "VADER Down - Selling Energy Detected!")
alertcondition(Alert_swing, "... VADER Crossing 0",         "VADER Swing - Possible Reversal")

// ===========================================================================================================
//      v3.0 more alerts for VADER crossing Sentiment
// ===========================================================================================================

v_speedup = ta.crossover(anp_s, V_senti)
v_slowdn  = ta.crossunder(anp_s, V_senti)
alertcondition(v_speedup,   "*  VADER Speeding Up",      "VADER Speeding Up!")
alertcondition(v_slowdn,    "** VADER Slowing Down",    "VADER Slowing Down!")


if Alert_up
    strategy.entry("Enter Long", strategy.long)
else if Alert_dn
    strategy.entry("Enter Short", strategy.short)
- توانائی کی سلاخوں کے ساتھ ریڈ کے ڈبل ویڈر
- چلتی اوسط اور بولنگر بینڈ پر مبنی مقداری تجارتی حکمت عملی
- چلتی اوسط کراس الرٹ، ملٹی ٹائم فریم (MTF)
- HALFTREND + HEMA + SMA (غلط سگنل کی حکمت عملی)
- رینبو اوسیلیٹر
- ریڈ کے مومنٹم بارز
- ای ایس ایس ایم اے
- سپر اسکیلپر
- سپر جمپ ٹرن بیک بولنگر بینڈ
- زیادہ ذہین MACD
- آرڈر بلاک فائنڈر
- TrendScalp-FractalBox-3EMA
- QQE سگنل
- U بٹ گرڈ طول و عرض فلٹر
- CM MACD کسٹم اشارے - متعدد ٹائم فریم - V2
- ہول لائن
- 2 حرکت پذیر اوسط رنگ سمت کا پتہ لگانے
- اسکیلپنگ پل بیک ٹول R1
- خرید و فروخت کی حکمت عملی AO+Stoch+RSI+ATR پر منحصر ہے
- ای ایم اے ٹرینڈ کلاؤڈ
- Donchian بریک آؤٹ کوئی repaint
- ریڈ کے مومنٹم بارز
- سپر جمپ ٹرن بیک بولنگر بینڈ
- فوکوز رجحان
- جانی کی BOT
- ایس ایس ایل ہائبرڈ
- لوڈشیلڈر باہر نکلیں
- ریسوٹو
- ای ایم اے کلاؤڈ انٹرا ڈے حکمت عملی
- پییوٹ پوائنٹ سپر ٹرینڈ