توانائی کی سلاخوں کے ساتھ ریڈ کے ڈبل ویڈر
مصنف:چاؤ ژانگ، تاریخ: 2022-05-24 11:49:07ٹیگز:ایس ایم اےای ایم اےڈبلیو ایم اے
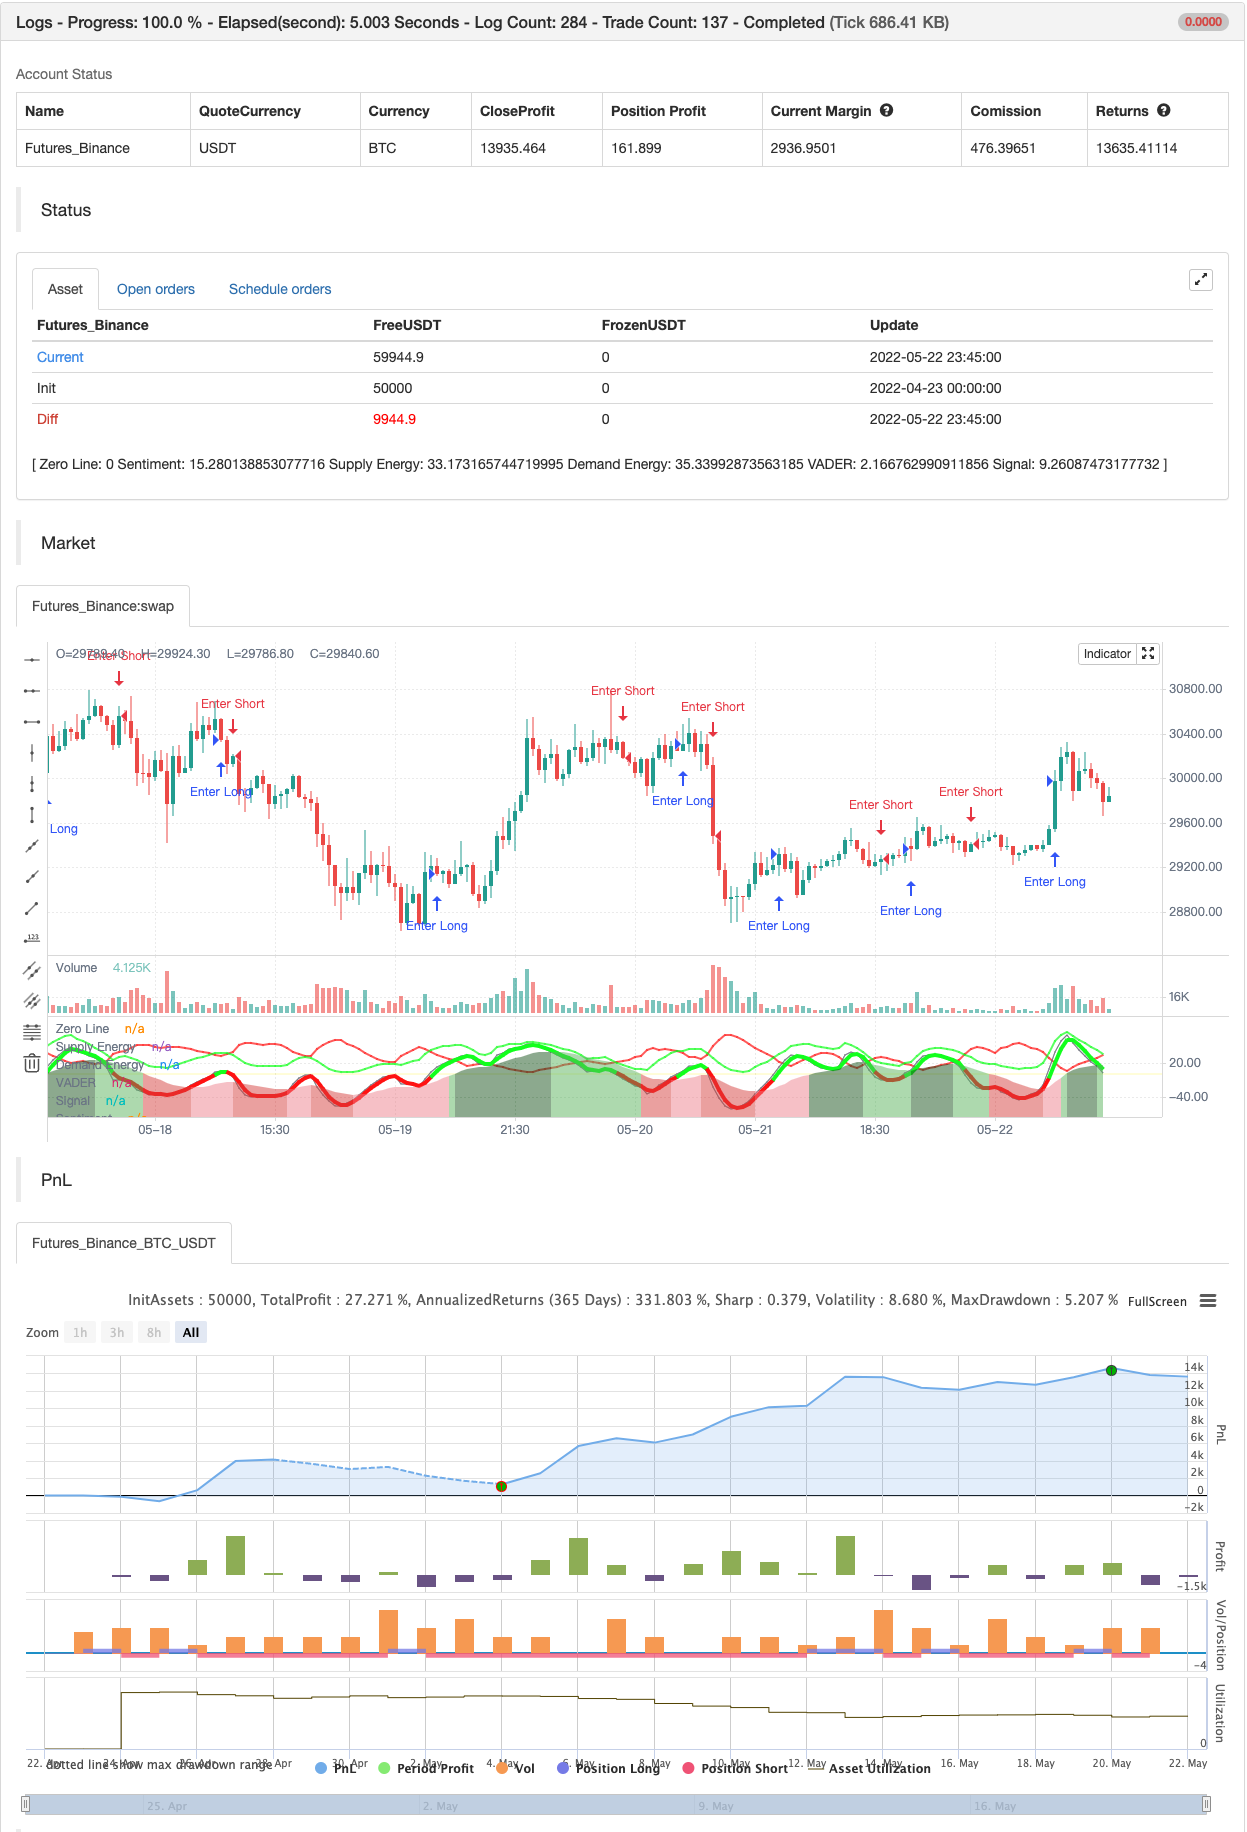
میں نے VADER-DEB میں شامل بصری بہتری مارکیٹ کی کارروائی کے بارے میں مزید بصیرت لانے میں مدد ملتی ہے
- ڈیفالٹ کی طرف سے دوہری / طویل VADER پلاٹ کو بے نقاب (جو ہم جذبات کے لئے ایک پراکسی کے طور پر استعمال کرتے ہیں) - اور یہ اب ایک علاقے کے طور پر ظاہر ہوتا ہے (ایک ہسٹوگرام کی بجائے) - آپ اب بھی اشارے کی ترتیبات میں جذبات پلاٹ چھپانے کر سکتے ہیں اور
- directional
energy bars استعمال کرتے ہوئے (v3.0 میں توانائی کی لائنوں کے بجائے) ۔ اختیاری سرخ / سبز DER لائنیں مطالعہ کی ترتیبات میں دستیاب ہیں اور ڈیفالٹ کے ذریعہ پوشیدہ ہیں۔
تو یہ دوہری VADER w/ توانائی سلاخوں
یہ تبدیلیاں کچھ لوگوں کے نزدیک چھوٹی سمجھی جاسکتی ہیں ، لیکن میرے خیال میں ، مجھے وہ زیادہ بصری طور پر دلکش اور
کوڈ کے اندر بنیادی حساب کتاب میں کوئی تبدیلی نہیں ہے۔ جیسا کہ اوپر دیئے گئے چارٹ میں دکھایا گیا ہے جہاں ہم VADER کے دونوں ورژنوں کا آپس میں موازنہ کرتے ہیں۔
اگر آپ VADER v3.0 سے مطمئن ہیں تو، براہ کرم اسے استعمال کرنے کے لئے آزاد محسوس کریں.
اچھی قسمت!
بیک ٹسٹ
/*backtest
start: 2022-04-23 00:00:00
end: 2022-05-22 23:59:00
period: 45m
basePeriod: 5m
exchanges: [{"eid":"Futures_Binance","currency":"BTC_USDT"}]
*/

// This source code is subject to the terms of the Mozilla Public License 2.0 at https://mozilla.org/MPL/2.0/
// © RedKTrader

//@version=5
indicator('RedK Dual VADER with Energy Bars [VADER-DEB]', 'RedK VADER-DEB v4.0', precision=0, timeframe='', timeframe_gaps=false)

// This version is the same as VADER v3.0 with enhanced visuals, using Energy Bars instead of the positive/energy lines
// Sentiment plot changed from histogram to area and is exposed by default (hence Dual w/ Energy Bars -- DEB)
// No change in core calculations from VADER v3.0  -- and that's why i'll just call it VADER v4.0

// ***********************************************************************************************************
// Choose volume calculation method.. Relative vs full.
// Relative magnifies effect of recent volume spikes (up or down)
f_RelVol(_value, _length) =>
    min_value = ta.lowest(_value, _length)
    max_value = ta.highest(_value, _length)
    ta.stoch(_value, max_value, min_value, _length) / 100
// ***********************************************************************************************************

// ***********************************************************************************************************
// Choose MA type for the base DER calculation ..
// WMA is my preference and is default .. SMA is really slow and lags a lot - but added for comparison
f_derma(_data, _len, MAOption) =>
    value =
      MAOption == 'SMA' ? ta.sma(_data, _len) :
      MAOption == 'EMA' ? ta.ema(_data, _len) :
      ta.wma(_data, _len)
// ***********************************************************************************************************


// ===========================================================================================================
//      Inputs
// ===========================================================================================================

price   = close
length  = input.int(10, minval=1)
DER_avg = input.int(5, 'Average', minval=1, inline='DER', group='Directional Energy Ratio')
MA_Type = input.string('WMA', 'DER MA type', options=['WMA', 'EMA', 'SMA'], inline='DER', group='Directional Energy Ratio')
smooth  = input.int(3, 'Smooth', minval=1,  inline='DER_1', group='Directional Energy Ratio')

show_senti = input.bool(true, 'Sentiment',  inline='DER_s', group='Directional Energy Ratio')
senti   = input.int(20, 'Length', minval=1, inline='DER_s', group='Directional Energy Ratio')


v_calc  = input.string('Relative', 'Calculation', options=['Relative', 'Full', 'None'], group='Volume Parameters')
vlookbk = input.int(20, 'Lookback (for Relative)', minval=1,                            group='Volume Parameters')

// ===========================================================================================================
//          Calculations
// ===========================================================================================================

// Volume Calculation Option  -- will revert to no volume acceleration for instruments with no volume data
vola    =
  v_calc == 'None' or na(volume) ? 1 :
  v_calc == 'Relative' ? f_RelVol(volume, vlookbk) :
  volume

R       = (ta.highest(2) - ta.lowest(2)) / 2                    // R is the 2-bar average bar range - this method accomodates bar gaps
sr      = ta.change(price) / R                                  // calc ratio of change to R
rsr     = math.max(math.min(sr, 1), -1)                         // ensure ratio is restricted to +1/-1 in case of big moves
c       = fixnan(rsr * vola)                                    // add volume accel -- fixnan adresses cases where no price change between bars

c_plus  = math.max(c, 0)                                        // calc directional vol-accel energy
c_minus = -math.min(c, 0)

// plot(c_plus)
// plot(c_minus)


avg_vola    = f_derma(vola, length, MA_Type)
dem         = f_derma(c_plus, length, MA_Type)  / avg_vola          // directional energy ratio
sup         = f_derma(c_minus, length, MA_Type) / avg_vola

adp         = 100 * ta.wma(dem, DER_avg)                            // average DER
asp         = 100 * ta.wma(sup, DER_avg)
anp         = adp - asp                                             // net DER..
anp_s       = ta.wma(anp, smooth)

// Calculate Sentiment - a VADER for a longer period and can act as a baseline (compared to a static 0 value)
// note we're not re-calculating vol_avg, demand or supply energy for sentiment. this would've been a different approach
s_adp       = 100 * ta.wma(dem, senti)                            // average DER for sentiment length
s_asp       = 100 * ta.wma(sup, senti)
V_senti     = ta.wma(s_adp - s_asp, smooth)


// ===========================================================================================================
//      Colors & plots
// ===========================================================================================================
c_adp   = color.new(#11ff20, 30)
c_asp   = color.new(#ff1111, 30)
c_fd    = color.new(color.green, 80)
c_fs    = color.new(color.red, 80)
c_zero  = color.new(#ffee00, 70)

c_up    = color.new(#11ff20, 0)
c_dn    = color.new(#ff1111, 0)

up      = anp_s >= 0
s_up    = V_senti >=0

hline(0, 'Zero Line', c_zero, hline.style_solid)

// =============================================================================
// v4.0 --- Sentiment will be represented as a 4-color area graph
c_grow_above = #1b5e2080
c_grow_below = #dc4c4a80
c_fall_above = #66bb6a80
c_fall_below = #ef8e9880

sflag_up = math.abs(V_senti) >= math.abs(V_senti[1])

plot(show_senti ? V_senti : na, "Sentiment", style=plot.style_area,
 color = s_up ? (sflag_up ? c_grow_above : c_fall_above) :
 sflag_up ? c_grow_below : c_fall_below)

// ===========================================================================================================
//      v4.0 Use Energy Bars instead of DER lines
// ===========================================================================================================

// Prep the Energy Bars
bo = asp
bc = adp
bh = math.max(bo, bc)
bl = math.min(bo, bc)

rising      = ta.change(bc) > 0

c_barup     = #11ff2088
c_bardn     = #ff111188
c_bardj     = #ffffff88

barcolor    = bc > bo and rising ? c_barup : bc < bo and not rising ? c_bardn : c_bardj
//plotcandle(bo, bh, bl, bc, 'Energy Bars', barcolor, barcolor, bordercolor = barcolor)

// ============================================================================================================

s = plot(asp, 'Supply Energy', c_asp, 2, display = display.none)
d = plot(adp, 'Demand Energy', c_adp, 2, display = display.none)

plot(anp, 'VADER', color.new(color.gray, 30), display=display.none)
plot(anp_s, 'Signal', up ? c_up : c_dn, 4)

// ===========================================================================================================
//      v2.0 adding alerts
// ===========================================================================================================

Alert_up    = ta.crossover(anp_s,0)
Alert_dn    = ta.crossunder(anp_s,0)
Alert_swing = ta.cross(anp_s,0)

// "." in alert title for the alerts to show in the right order up/down/swing
alertcondition(Alert_up,    ".   VADER Crossing 0 Up",      "VADER Up - Buying Energy Detected!")
alertcondition(Alert_dn,    "..  VADER Crossing 0 Down",    "VADER Down - Selling Energy Detected!")
alertcondition(Alert_swing, "... VADER Crossing 0",         "VADER Swing - Possible Reversal")

// ===========================================================================================================
//      v3.0 more alerts for VADER crossing Sentiment
// ===========================================================================================================

v_speedup = ta.crossover(anp_s, V_senti)
v_slowdn  = ta.crossunder(anp_s, V_senti)
alertcondition(v_speedup,   "*  VADER Speeding Up",      "VADER Speeding Up!")
alertcondition(v_slowdn,    "** VADER Slowing Down",    "VADER Slowing Down!")


if Alert_up
    strategy.entry("Enter Long", strategy.long)
else if Alert_dn
    strategy.entry("Enter Short", strategy.short)
- چلتی اوسط اور بولنگر بینڈ پر مبنی مقداری تجارتی حکمت عملی
- چلتی اوسط کراس الرٹ، ملٹی ٹائم فریم (MTF)
- HALFTREND + HEMA + SMA (غلط سگنل کی حکمت عملی)
- ریڈ کے حجم تیز رفتار سمت توانائی کا تناسب
- رینبو اوسیلیٹر
- ریڈ کے مومنٹم بارز
- ای ایس ایس ایم اے
- سپر اسکیلپر
- سپر جمپ ٹرن بیک بولنگر بینڈ
- زیادہ ذہین MACD
- بہترین نگلنگ + بریک آؤٹ حکمت عملی
- بولنگر زبردست الرٹ R1
- ملٹی ایکسچینج بیک وقت پلگ ان
- ٹرائیگون سود (چھوٹی کرنسیوں کی قیمتوں میں فرق حاصل کرنا)
- بائی بٹ ریورس کنٹریکٹ متحرک گرڈ (خصوصی گرڈ)
- MT4 MT5 + متحرک متغیرات کے لئے ٹریڈنگ ویو انتباہات
- میٹرکس سیریز
- سپر اسکیلپر - 5 منٹ 15 منٹ
- رشتہ دار طاقت کا انڈیکس - اختلافات - لبرٹوس
- لکیری رجسٹریشن ++
- کنسولیڈیشن زونز - لائیو
- مقداری معیار کا اندازہ
- چلتی اوسط کراس الرٹ، ملٹی ٹائم فریم (MTF)
- ایم اے سی ڈی ری لوڈ شدہ حکمت عملی
- سپر ٹرینڈڈ چلتی اوسط
- ٹریڈنگ اے بی سی
- 15MIN BTCUSDTPERP BOT
- شینن اینٹروپی V2
- SUPERTREND ATR کے ساتھ ٹریلنگ سٹاپ نقصان
- حجم بہاؤ v3