بہترین نگلنگ + بریک آؤٹ حکمت عملی
مصنف:چاؤ ژانگ، تاریخ: 2022-05-25 14:40:18ٹیگز:آر ایم اےای ایم اےڈبلیو ایم اے
ہیلو تاجروں
یہ ٹریڈنگ ویو حکمت عملی کے لئے ایک سادہ الگورتھم ہے جس میں 2 غیر متعلقہ اشارے کے تبادلوں کا سراغ لگایا جاتا ہے۔
تبادلہ میرے تجارتی مسائل کا حل ہے. یہ لامحدود امکانات اور صرف چند کام کرنے والے مجموعے کے ساتھ ایک پہیلی ہے.
یہاں ایک ہے کہ مجھے پسند ہے
- نگلنے کا نمونہ
- بریک آؤٹ کا پتہ لگانے کے لئے قیمت بمقابلہ چلتی اوسط
تعریف
نوٹ بک نکالیں :) اور کچھ کافی (توجہ کے لئے اچھا ہے). میں کافی میں تیزی سے ہوں
نگلنے کا نمونہ دو موم بتیوں کا الٹ نمونہ ہے۔ دوسری شمع مکمل طور پر پہلی شمع کے اصل جسم کو نگل لیتی ہے، اس کے پیچھے کے سائے کی لمبائی سے قطع نظر۔
بولش اینگلفنگ پیٹرن ایک ڈاؤن ٹرینڈ میں ظاہر ہوتا ہے اور ایک بڑی سبز موم بتی کے بعد ایک سرخ موم بتی کا مجموعہ ہے bearish Engulfing پیٹرن ایک نیچے کے رجحان میں ظاہر ہوتا ہے اور ایک بڑی سرخ موم بتی کے بعد ایک سبز موم بتی کا ایک مجموعہ ہے
مثال:https://imgur.com/a/krDDUz4
ہم بور ہو رہے ہیں سر... اس سب کا کیا مطلب ہے؟
خلاصہ یہ کہ، ایک نگلنگ ریورسز کو ٹریک کرنے کے لئے ایک نمونہ ہے. (تمام ٹریڈنگ ویو سامعین اب کھڑے ہو جاتے ہیں اور کھڑے ہو کر تالیاں بجاتے ہیں) قیمت بمقابلہ چلتی اوسط فلٹرز کا اضافہ رفتار کے ساتھ ردوبدل کو ٹریک کرنے کی اجازت دیتا ہے (آدھے سامعین گر گیا کیونکہ یہ بہت خوفناک ہے)
ٹھیک ہے سر... آپ نے میری دلچسپی کا اظہار کیا
میں نے کچھ ٹھنڈے بیک ٹیسٹ فلٹرز شامل کیے ہیں:
- تاریخ کی حد فلٹرنگ
- لچکدار منافع USD قیمت میں (نیلے رنگ میں دکھایا گیا)
- امریکی ڈالر کی قیمت میں لچکدار سٹاپ نقصان (سرخ میں دکھایا گیا)
سب سے بہتر ڈیو
بیک ٹسٹ
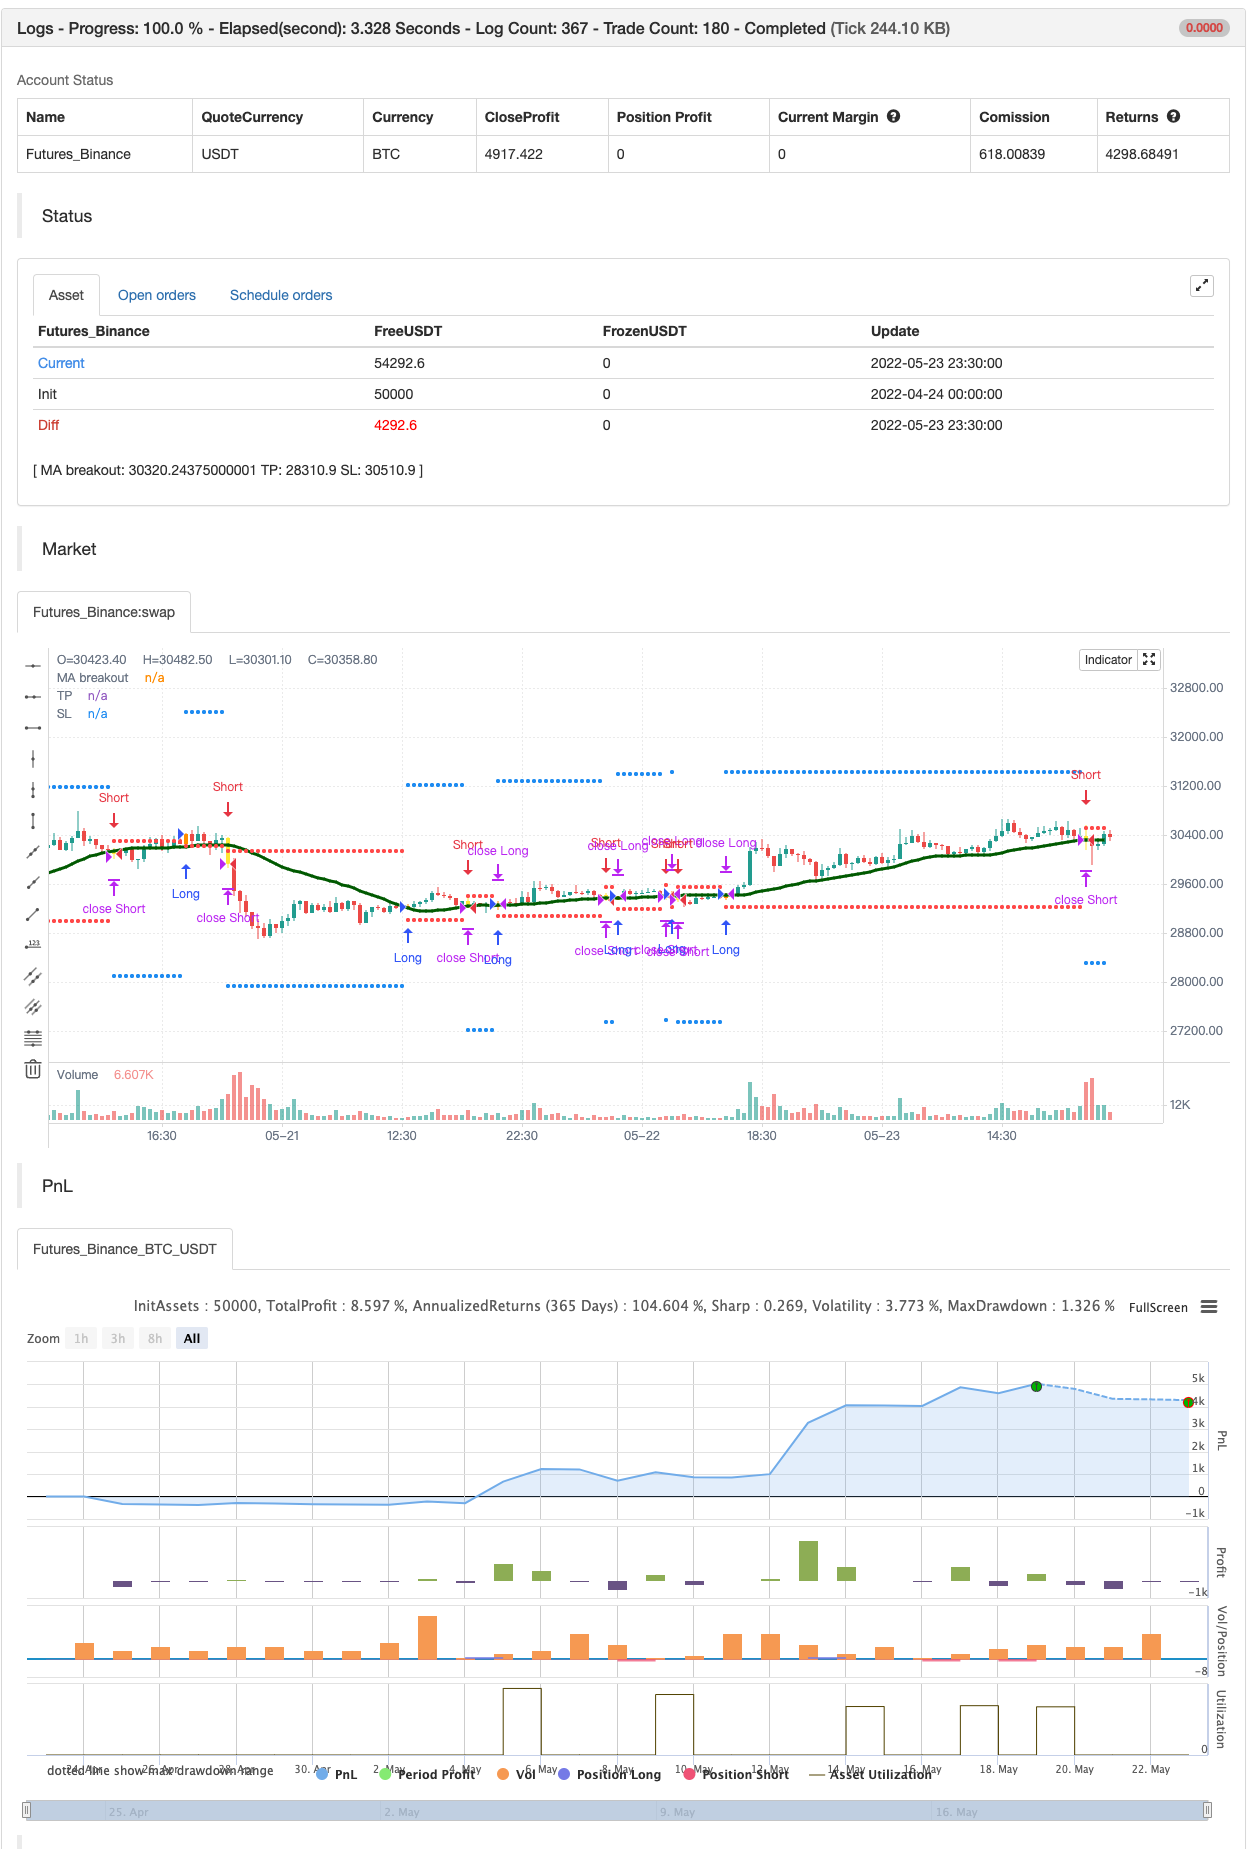
/*backtest
start: 2022-04-24 00:00:00
end: 2022-05-23 23:59:00
period: 30m
basePeriod: 15m
exchanges: [{"eid":"Futures_Binance","currency":"BTC_USDT"}]
*/

//@version=4
//@author=Daveatt

StrategyName = "BEST Engulfing + MA"
ShortStrategyName = "BEST Engulfing + MA"

strategy(title=StrategyName, shorttitle=ShortStrategyName, overlay=true,
 pyramiding=2, default_qty_value=500, precision=7, currency=currency.USD,
 commission_value=0.2,commission_type=strategy.commission.percent, initial_capital=10000)

includeEngulfing = true

includeMA = true
source_ma = input(title="Source Price vs MA", type=input.source, defval=close)
typeofMA = input(title="Type of MA", defval="SMA", options=["RMA", "SMA", "EMA", "WMA", "VWMA", "SMMA", "KMA", "TMA", "HullMA", "DEMA", "TEMA"])
length_ma = input(32, title = "MA Length", type=input.integer)

// ---------- Candle components and states
GreenCandle = close > open
RedCandle = close < open
NoBody = close==open
Body = abs(close-open)


// bullish conditions
isBullishEngulfing1 = max(close[1],open[1]) < max(close,open) and min(close[1],open[1]) > min(close,open) and Body > Body[1] and GreenCandle and RedCandle[1]
isBullishEngulfing2 = max(close[1],open[1]) < max(close,open) and min(close[1],open[1]) <= min(close,open) and Body > Body[1] and GreenCandle and RedCandle[1]

// bearish conditions
isBearishEngulfing1 = max(close[1],open[1]) < max(close,open) and min(close[1],open[1]) > min(close,open) and Body > Body[1] and RedCandle and GreenCandle[1]
isBearishEngulfing2 = max(close[1],open[1]) >= max(close,open) and min(close[1],open[1]) > min(close,open) and Body > Body[1] and RedCandle and GreenCandle[1]

// consolidation of conditions
isBullishEngulfing = isBullishEngulfing1 or isBullishEngulfing2
isBearishEngulfing = isBearishEngulfing1 or isBearishEngulfing2

//isBullishEngulfing = max(close[1],open[1]) < max(close,open) and min(close[1],open[1]) > min(close,open) and Body > Body[1] and GreenCandle and RedCandle[1]
//isBearishEngulfing = max(close[1],open[1]) < max(close,open) and min(close[1],open[1]) > min(close,open) and Body > Body[1] and RedCandle and GreenCandle[1]

Engulf_curr = 0 - barssince(isBearishEngulfing) + barssince(isBullishEngulfing)
Engulf_Buy = Engulf_curr < 0 ? 1 : 0
Engulf_Sell = Engulf_curr > 0 ? 1 : 0


// Price vs MM


smma(src, len) =>
    smma = 0.0
    smma := na(smma[1]) ? sma(src, len) : (smma[1] * (len - 1) + src) / len
    smma

ma(smoothing, src, length) =>
    if smoothing == "RMA"
        rma(src, length)
    else
        if smoothing == "SMA"
            sma(src, length)
        else
            if smoothing == "EMA"
                ema(src, length)
            else
                if smoothing == "WMA"
                    wma(src, length)
				else
					if smoothing == "VWMA"
						vwma(src, length)
					else
						if smoothing == "SMMA"
						    smma(src, length)
						else
							if smoothing == "HullMA"
								wma(2 * wma(src, length / 2) - wma(src, length), round(sqrt(length)))
							else
								if smoothing == "LSMA"
									src
								else
								    if smoothing == "KMA"
								        xPrice = src
                                        xvnoise = abs(xPrice - xPrice[1])
                                        nfastend = 0.666
                                        nslowend = 0.0645
                                        nsignal = abs(xPrice - xPrice[length])
                                        nnoise = sum(xvnoise, length)
                                        nefratio = iff(nnoise != 0, nsignal / nnoise, 0)
                                        nsmooth = pow(nefratio * (nfastend - nslowend) + nslowend, 2)
                                        nAMA = 0.0
                                        nAMA := nz(nAMA[1]) + nsmooth * (xPrice - nz(nAMA[1]))
                                        nAMA
								    else
								        if smoothing == "TMA"
									        sma(sma(close, length), length)
						                else
							                if smoothing == "DEMA"
							                    2 * src - ema(src, length)
							                else
							                    if smoothing == "TEMA"
							                        3 * (src - ema(src, length)) + ema(ema(src, length), length)
							                    else
		    							            src


MA = ma(typeofMA, source_ma, length_ma)

plot(MA, color=#006400FF, title="MA breakout", linewidth=3)

macrossover  = crossover (source_ma, MA)
macrossunder = crossunder(source_ma, MA)

since_ma_buy = barssince(macrossover)
since_ma_sell = barssince(macrossunder)
macross_curr = 0 - since_ma_sell + since_ma_buy
bullish_MA_cond = macross_curr < 0 ?  1 : 0
bearish_MA_cond = macross_curr > 0 ? 1  : 0

posUp = (Engulf_Buy ? 1 : 0) + (bullish_MA_cond ? 1 : 0)
posDn = (Engulf_Sell ? 1 : 0) + (bearish_MA_cond ? 1 : 0)

conditionUP = posUp == 2 and posUp[1] < 2
conditionDN = posDn == 2 and posDn[1] < 2


sinceUP = barssince(conditionUP)
sinceDN = barssince(conditionDN)

// primary-first signal of the trend
nUP = crossunder(sinceUP,sinceDN)
nDN = crossover(sinceUP,sinceDN)


// and the following secondary signals

// save of the primary signal
sinceNUP = barssince(nUP)
sinceNDN = barssince(nDN)

buy_trend   = sinceNDN > sinceNUP
sell_trend  = sinceNDN < sinceNUP

// engulfing by
barcolor(nUP ? color.orange : na, title="Bullish condition")
barcolor(nDN ? color.yellow : na, title="Bearish condition")

isLong  = nUP
isShort = nDN

long_entry_price    = valuewhen(nUP, close, 0)
short_entry_price   = valuewhen(nDN, close, 0)

longClose   = close[1] < MA
shortClose  = close[1] > MA

///////////////////////////////////////////////
//* Backtesting Period Selector | Component *//
///////////////////////////////////////////////


StartYear = input(2017, "Backtest Start Year",minval=1980)
StartMonth = input(1, "Backtest Start Month",minval=1,maxval=12)
StartDay = input(1, "Backtest Start Day",minval=1,maxval=31)
testPeriodStart = timestamp(StartYear,StartMonth,StartDay,0,0)

StopYear = input(2020, "Backtest Stop Year",minval=1980)
StopMonth = input(12, "Backtest Stop Month",minval=1,maxval=12)
StopDay = input(31, "Backtest Stop Day",minval=1,maxval=31)
testPeriodStop = timestamp(StopYear,StopMonth,StopDay,0,0)

testPeriod() => true


//////////////////////////
//* Profit Component *//
//////////////////////////

input_tp_pips = input(2000, "Backtest Profit Goal (in USD)",minval=0)
input_sl_pips = input(200, "Backtest STOP Goal (in USD)",minval=0)


tp = buy_trend? long_entry_price + input_tp_pips : short_entry_price - input_tp_pips
sl = buy_trend? long_entry_price - input_sl_pips : short_entry_price + input_sl_pips


long_TP_exit  = buy_trend and high >= tp
short_TP_exit = sell_trend and low <= tp

plot(tp, title="TP", style=plot.style_circles, linewidth=3, color=color.blue)
plot(sl, title="SL", style=plot.style_circles, linewidth=3, color=color.red)

if testPeriod()
    strategy.entry("Long", 1, when=isLong)
    strategy.close("Long", when=longClose )
    strategy.exit("XL","Long", limit=tp,  when=buy_trend, stop=sl)


if testPeriod()
    strategy.entry("Short", 0,  when=isShort)
    strategy.close("Short", when=shortClose )
    strategy.exit("XS","Short", when=sell_trend, limit=tp, stop=sl)
- رینبو اوسیلیٹر
- سپر اسکیلپر
- سپر جمپ ٹرن بیک بولنگر بینڈ
- ای ایس ایس ایم اے
- زیادہ ذہین MACD
- سپر اسکیلپر - 5 منٹ 15 منٹ
- خرید/فروخت کے ساتھ EMA ADX RSI کا اسکیلپنگ
- رفتار پر مبنی زگ زگ
- وی ڈبلیو ایم اے-اے ڈی ایکس مومنٹم اور ٹرینڈ پر مبنی بٹ کوائن لانگ حکمت عملی
- ولیمز %R - ہموار
- پییوٹ پر مبنی ٹریلنگ زیادہ سے زیادہ اور کم سے کم
- نِک رِپاک ٹریلنگ ریورس (NRTR)
- ZigZag PA حکمت عملی V4.1
- دن کے اندر خرید/فروخت
- ٹوٹا ہوا فریکٹل: کسی کا ٹوٹا ہوا خواب آپ کا منافع ہے!
- منافع بڑھانے والا PMax
- ناقص فتح کی حکمت عملی
- اسٹوکاسٹک + آر ایس آئی، ڈبل حکمت عملی
- سوئنگ ہول/آر ایس آئی/ای ایم اے حکمت عملی
- اسکیلپنگ سوئنگ ٹریڈنگ ٹول R1-4
- بولنگر زبردست الرٹ R1
- ملٹی ایکسچینج بیک وقت پلگ ان
- ٹرائیگون سود (چھوٹی کرنسیوں کی قیمتوں میں فرق حاصل کرنا)
- بائی بٹ ریورس کنٹریکٹ متحرک گرڈ (خصوصی گرڈ)
- MT4 MT5 + متحرک متغیرات کے لئے ٹریڈنگ ویو انتباہات
- میٹرکس سیریز
- سپر اسکیلپر - 5 منٹ 15 منٹ
- رشتہ دار طاقت کا انڈیکس - اختلافات - لبرٹوس
- لکیری رجسٹریشن ++
- توانائی کی سلاخوں کے ساتھ ریڈ کے ڈبل ویڈر