72s: ایڈجسٹ ہول چلتی اوسط +
مصنف:چاؤ ژانگ، تاریخ: 2022-05-26 17:17:37ٹیگز:ایچ ایم اےاے ٹی آر
ابتدائی تاجروں کے لئے ایک چیلنجنگ مسئلہ مارکیٹ کے حالات کو فرق کرنا ہے ، چاہے موجودہ مارکیٹ منافع کو جلد از جلد ، کم سے کم وقت میں جمع کرنے کا بہترین موقع فراہم کررہی ہے یا نہیں ، یا نہیں۔
انٹرا ڈے پر ، ہم نے دیکھا ہے کہ بڑے بینکوں کی طرف سے کچھ بڑی کارروائیوں کو کسی حد تک HMA 200 کے ذریعہ بیان کیا جاسکتا ہے۔ میں اس بارے میں سوچ رہا ہوں کہ جب یہ شروع ہوتا ہے تو اس کی واضح علامتیں حاصل کرنے کے ل visuals بصری کو قیمت کی حرکیات کے مطابق (بڑی نقل و حرکت اور معمولی شور کو الگ کرنا) زیادہ مناسب بنایا جائے۔ لہذا یہ ایک نظر میں دیکھنا آسان ہوگا کہ جب طاقت واقعی شروع ہوتی ہے تو ، کم گندا چارٹ کے ساتھ۔
یہ موافقت پذیر ایچ ایم اے نئی پائن اسکرپٹ کی خصوصیت کا استعمال کررہا ہے جو اب متعدد پائن افعال کے لئے متحرک لمبائی کے دلائل کی حمایت کرتا ہے۔ (پڑھیں:https://www.tradingview.com/blog/en/pine..اس نے براہ راست بلٹ ان ایچ ایم اے () کی حمایت نہیں کی ہے ، لیکن خوش قسمتی سے ہم اس کے تعمیر کے لئے اس کے wma () فارمولے کا استعمال کرسکتے ہیں۔ (نوٹ: میں نے یہاں پہلے سے ہی مقبول ایچ ایم اے فارمولے کو تھوڑا سا ٹویٹ کیا ہے جس میں اس کی wma
آپ منتخب کر سکتے ہیں کہ کس پہلو میں موافقت پذیر ایچ ایم اے کی مدت کو اپنانا ہے.
اس مطالعے میں میں اسے دو اختیارات کے ساتھ پیش کرتا ہوں: حجم اور اتار چڑھاؤ۔ یہ اس بات پر منحصر ہے کہ اس پہلو میں فی الحال کس صورتحال میں ہے اس پر منحصر ہے کہ یہ تیزی سے یا آہستہ آہستہ چلتا ہے۔ یعنی: جب حجم عام طور پر کم ہوتا ہے یا اتار چڑھاؤ کی ریڈنگ موجود نہیں ہوتی ہے تو ، قیمت بہت زیادہ نہیں چلتی ہے ، لہذا موافقت پذیر ایم اے متحرک طور پر لمبائی کی مدت کو بڑھا کر سست ہوجائے گی ، اور اس کے برعکس ، اور اسی طرح۔
ایڈاپٹیو میں رنگوں کے نشانات اس صورتحال کی طرح ہیں جو اوپر بیان کی گئی ہے۔ اس کے علاوہ ، میں اسے ایم اے کے ڈھلوان کے حساب سے بھی جوڑتا ہوں تاکہ رجحان کی طاقت یا سائیڈ وے / ہاپپی حالات کی پیمائش میں مدد ملے۔
اس طرح جب ہم اسے متحرک حمایت / مزاحمت کے طور پر استعمال کرتے ہیں تو یہ زیادہ بصری طور پر قابل اعتماد ہوگا.
دوسرا ، اور اس سے بھی اہم بات ، یہ ہمارے تاجروں کی مدد کرسکتا ہے کہ آیا تجارت کرنے کے قابل ہے یا نہیں۔ یعنی: اگر درمیانی وقت میں مارکیٹ زیادہ حرکت نہیں دے گی تو ، کوئی منافع بھی اتنا ہی ہوگا۔ زیادہ تر معاملات میں ، ہم بہتر ہوسکتے ہیں کہ بعد میں اپنے پیسہ بچائیں یا اسے کہیں اور رکھیں۔
استعمال کے طریقے: بہتر متحرک حمایت/مقاومت اور واضح توڑ کی تصدیق کے علاوہ، ایم اے مندرجہ ذیل رنگ میں ہے: پیلا: مارکیٹ مستحکم یا فلیٹ ہے۔ چاہے یہ سائیڈ ویز ، ہلکا پھلکا ہو ، یا نسبتا small چھوٹی نقل و حرکت میں ہو۔ اگر یہ رجحان سازی کی مارکیٹ میں ظاہر ہوتا ہے تو ، یہ ایک ابتدائی علامت ہوسکتی ہے کہ موجودہ رجحان اپنی سمت تبدیل کرنے کے بارے میں ہوسکتا ہے ، یا قیمت کو دوسری طرف توڑنے کی تصدیق کرسکتا ہے۔ ہلکا سبز یا ہلکا سرخ: یہ بتاتا ہے کہ اگر کوئی رجحان تشکیل دے رہا ہے لیکن اب بھی نسبتا weak کمزور ہے (یا کمزور ہو رہا ہے) ، کیونکہ اس میں حجم یا اتار چڑھاؤ کی حمایت نہیں ہے۔ گہرا سبز یا گہرا سرخ: یہ وہ جگہ ہے جہاں ہم کچھ اچھی اور مضبوط قیمت کی نقل و حرکت کی توقع کرسکتے ہیں۔ اگر یہ کافی مضبوط ہے تو ، یہ اکثر ایک نئے دیرپا اہم رجحان کا آغاز کرتا ہے۔
ترتیبات:
چارجر:
منتخب کریں کہ آپ کا HMA کس پہلو میں خود کو پلگ کرنا چاہئے، اس طرح یہ اس کے مطابق ہوگا.
کم سے کم مدت، زیادہ سے زیادہ مدت:
172 - 233 صرف ایک دن کے لئے جامد ایچ ایم اے 200 سے بہتر بنانے کے لئے میری اپنی ترتیب ہے۔ مجھے لگتا ہے کہ
انتباہات: دو انتباہات ہیں: حجم توڑ: جب حجم اوسط سے اوپر ٹوٹ رہا ہے، اور اتار چڑھاؤ میٹر: جب مارکیٹ زیادہ امکان ہے کہ اس کا لمحہ بڑا گھومنے والا برش ہے.
استعمال: بہت بہت اچھا خریدنے کے اندراج کو پکڑنے کے لئے بڑا اپ تحریک اگر:
- قیمت MA سے اوپر ہے. (یہ سب سے بہتر ہے جب قیمت بھی MA سے بہت دور نہیں ہے، یا آپ بھی مدد کرنے کے لئے فاصلے کے آسکیلیٹر بھی استعمال کر سکتے ہیں)
- HMA
کا رنگ گہرے سبز رنگ میں ہے۔ اس کا مطلب یہ ہے کہ یہ آپ کے منتخب کردہ پہلو کے ساتھ چارجنگ پلگ پر ہے۔ - RSI 50 سے اوپر ہے. یہ اضافی تصدیق کے طور پر مدد کرنے کے لئے ہے.
صاف فروخت انٹری سگنل اوپر کے طور پر ایک ہی ہے، صرف اس کے برعکس.
بیک ٹسٹ
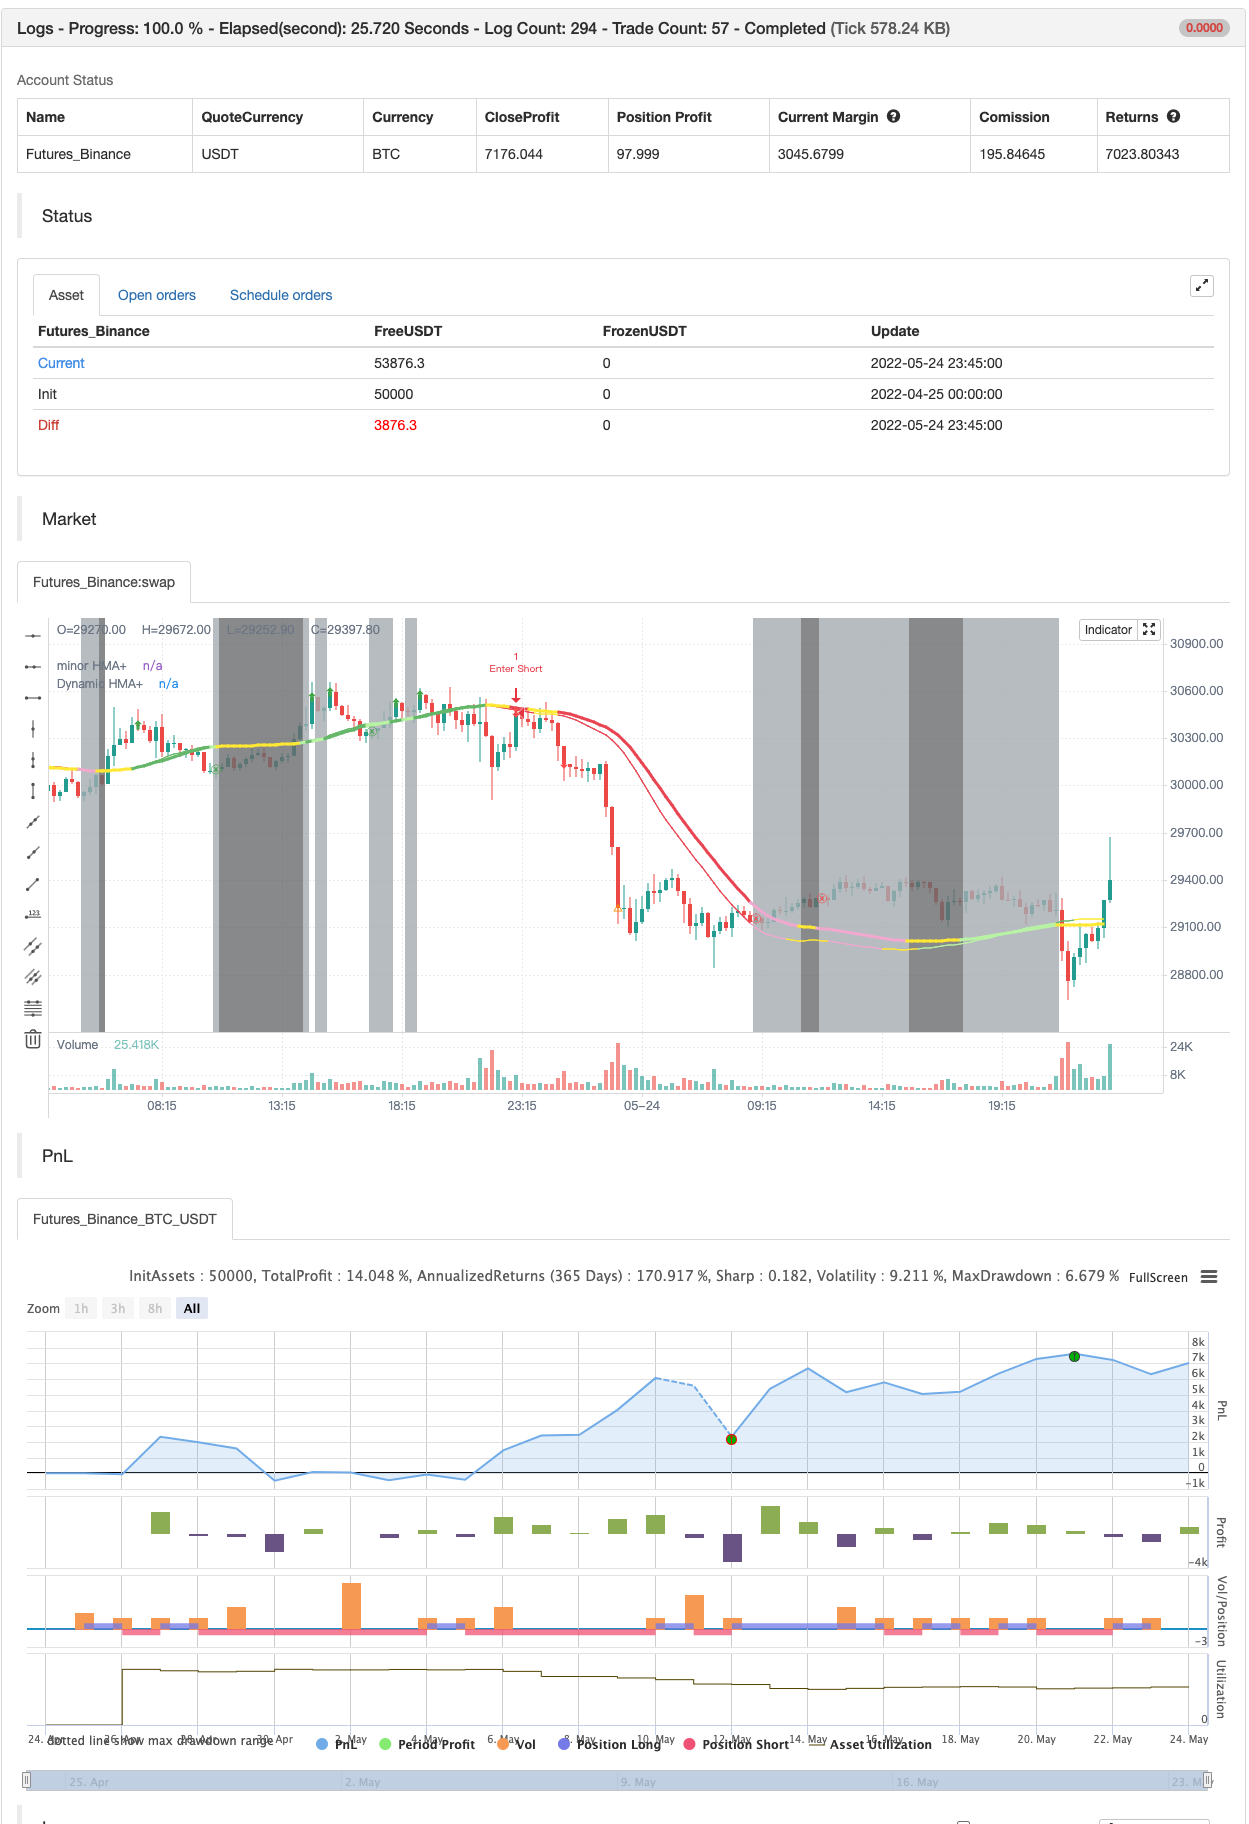
/*backtest
start: 2022-04-25 00:00:00
end: 2022-05-24 23:59:00
period: 15m
basePeriod: 5m
exchanges: [{"eid":"Futures_Binance","currency":"BTC_USDT"}]
*/

// This source code is subject to the terms of the Mozilla Public License 2.0 at https://mozilla.org/MPL/2.0/
// 2020 © io72signals / Antorio Bergasdito

//@version=4
study("72s: Adaptive Hull Moving Average+", shorttitle="72s: Adaptive HMA+", overlay=true)

//Optional Inputs
charger     = input("Volatility", title="Choose which charger to adapt to:", options=["Volatility", "Volume"])
src         = input(close, title="Source:")
minLength   = input(172, title="Minimum period:")
maxLength   = input(233, title="Maximum period:")
adaptPct    = 0.03141 //input(3.141, minval = 0, maxval = 100, title="Adapting Percentage:") / 100.0

flat        = input(17, title="Consolidation area is when slope below:")

showMinor   = input(true, title="Show minor xHMA+", group="Minor Adaptive HMA+ Period")
minorMin    = input(89, title="Minimum:", group="Minor Adaptive HMA+ Period", inline="mHMA+")
minorMax    = input(121, title="Maximum:", group="Minor Adaptive HMA+ Period", inline="mHMA+")

showZone    = input(false, title="Show Adaptive HMA+ Distance Zone", group="DISTANCE ZONE")
mult        = input(2.7, title="Distance (Envelope) Multiplier", step=.1, group="DISTANCE ZONE")

showSignals = input(true, title="Show Possible Signals", group="OTHER")
useBg       = input(true, title="Background color to differentiate movement", group="OTHER")

//Source to adapt to
highVolatility = atr(14) > atr(46)                  //Volatility Meter. Change it to match to your strat/pair/tf if needs.

rsivol  = rsi(volume,14)                            //RSI Volume Osc:
osc     = hma(rsivol,10)                            //Basically it's almost the same as: vol > ma(volume,20)
volBreak = osc > 49                                 //but smoothed using weight to filter noise or catch earlier signs.

//Dynamics
var float dynamicLength = avg(minLength,maxLength)
var float minorLength   = avg(minorMin,minorMax)
plugged = charger=="Volume"? volBreak : highVolatility
dynamicLength   := iff(plugged, max(minLength, dynamicLength * (1 - adaptPct)), min(maxLength, dynamicLength * (1 + adaptPct)))
minorLength     := iff(plugged, max(minorMin, minorLength * (1 - adaptPct)), min(minorMax, minorLength * (1 + adaptPct)))

//Slope calculation to determine whether market is in trend, or in consolidation or choppy, or might about to change current trend
slope_period = 34, range = 25, pi = atan(1) * 4
highestHigh = highest(slope_period), lowestLow = lowest(slope_period)
slope_range = range / (highestHigh - lowestLow) * lowestLow
calcslope(_ma)=>
    dt = (_ma[2] - _ma) / src * slope_range
    c = sqrt(1 + dt * dt)
    xAngle = round(180 * acos(1 / c) / pi)
    maAngle = iff(dt > 0, -xAngle, xAngle)
    maAngle

//MA coloring to mark market dynamics
dynColor(_ma,_col1a,_col1b, _col2a, _col2b, _col0) =>
    slope = calcslope(_ma)
    slope >= flat ? plugged? _col1a : _col1b :
     slope < flat and slope > -flat ? _col0 :
     slope <= -flat ? plugged? _col2a : _col2b : _col0

//Adaptive HMA
xhma(_src,_length) => _return = wma(2 * wma(_src, _length / 2) - wma(_src, _length), floor(sqrt(_length)))

dynamicHMA  = xhma(src,int(dynamicLength))      //<--Batman - Our main xHMA+
minorHMA    = xhma(src,int(minorLength))        //<--Robin  - Faster minor xHMA+ (Optional). Can be use to assist for
                                                //            faster entry, slower exit point, or pullbacks info too.

//Plot
plot(dynamicHMA, "Dynamic HMA+", dynColor(dynamicHMA, #6fbf73, #c0f5ae, #eb4d5c, #f2b1d4, color.yellow), 3)
plot(showMinor? minorHMA:na, "minor HMA+", dynColor(minorHMA, #6fbf73, #c0f5ae, #eb4d5c, #f2b1d4, color.yellow), 1)

//Backgroud coloring
notgreat = calcslope(dynamicHMA) < flat and calcslope(dynamicHMA) > -flat
bgcolor(useBg? plugged? na : notgreat? #757779: #afb4b9 : na)

// Comparative study
// staticHMA = hma(close, 200)
// plot(staticHMA,  "Static HMA")
// plotchar(dynamicLength, "dynamicLengthgth", "", location.top) //check output the calculated Dynamic Length in the Data Window.

//{ DISTANCE ZONE
// Envelope the main DynamicHMA with ATR band, just one way to approximate current price distance to MA. Other usages/methods may vary.
upperTL = dynamicHMA + mult * atr(40)        ,  lowerTL = dynamicHMA - mult * atr(40)           //<--Half distance zone
topTL = dynamicHMA + (mult*2) * atr(40)      ,  botTL = dynamicHMA - (mult*2) * atr(40)         //<--One distance zone
stopupperTL = dynamicHMA + (mult/2) * atr(40),  stoplowerTL = dynamicHMA - (mult/2) * atr(40)   //<--Half of the half. If need ie. tighter SL or trailing

// Plotting Distance Zone
plot(showZone?upperTL:na, color=color.green, transp=72)
plot(showZone?lowerTL:na, color=color.red,   transp=72)
plot(showZone?topTL:na, color=color.gray, transp=72)
plot(showZone?botTL:na, color=color.gray, transp=72)
sutl = plot(showZone?stopupperTL:na, color=color.white, transp=100)
sltl = plot(showZone?stoplowerTL:na, color=color.white, transp=100)
colZone = showZone? color.purple:color.new(color.white,100)
fill(sutl, sltl, color=colZone, transp=90)
//}

//{ SIGNALS
_slope = calcslope(dynamicHMA)

// Entry Base; When HMA+ turn to a darker color and market is out from low volatility.
// Remember to also considering price distance to MA and strength (ie. RSI)
_upSig = _slope >=  flat and plugged
_dnSig = _slope <= -flat and plugged
buy  = _upSig and not _upSig[1]
sell = _dnSig and not _dnSig[1]

// Possible Exits. These only based on faster xHMA+
_upExit = _slope>=flat  and (not plugged) and close<minorHMA
_dnExit = _slope<=-flat and (not plugged) and close>minorHMA
fastExits  = (_upExit and not _upExit[1]) or (_dnExit and not _dnExit[1])

// Caution Sign. When Price crossed most outer distance zone. Could also be a good TP spot if your already in profit
_topWarn    = high>topTL
_botWarn    = low<botTL
warningSigns = (_topWarn and not _topWarn[1]) or (_botWarn and not _botWarn[1])

// Plot 'em up
atrPos = 0.72 * atr(5)
plotchar(showSignals and buy?  dynamicHMA-atrPos: na, color=color.green, location=location.absolute, char="⬆", size = size.tiny)
plotchar(showSignals and sell? dynamicHMA+atrPos: na, color=color.red,   location=location.absolute, char="⬇", size = size.tiny)
plotchar(showSignals and fastExits? _upExit? minorHMA+atrPos: _dnExit? minorHMA-atrPos: na: na,
     color=_upExit?color.green:_dnExit?color.red: na, location=location.absolute, char="ⓧ", size=size.tiny)
plotchar(showSignals and warningSigns? _topWarn? high+atrPos: _botWarn? low-atrPos: na: na,
     color=color.orange, location=location.absolute, char="⚠", size=size.tiny)
//}

//{ ALERTS
// Previous alerts:
// alertcondition(highVolatility and not notgreat, "72s: Volatility Meter", "Market is on the move")
// alertcondition(volBreak[1] and volBreak and not notgreat, "72s: Volume Break", "Volume has just break above average")

// New Alert:
// Delete what alert you don't need:
if buy
    alert("Possible Buy Signal at" + tostring(close), alert.freq_once_per_bar_close)
if sell
    alert("Possible Sell Signal at" + tostring(close), alert.freq_once_per_bar_close)

if fastExits and _upExit
    alert("Price has just crossed down minor xHMA+ at" + tostring(close), alert.freq_once_per_bar_close)
if fastExits and _dnExit
    alert("Price has just crossed up minor xHMA+ at" + tostring(close), alert.freq_once_per_bar_close)

if warningSigns and _topWarn
    alert("Price has just crossed above top xHMA+ zone", alert.freq_once_per_bar_close)
if warningSigns and _botWarn
    alert("Price has just crossed below bottom xHMA+ zone", alert.freq_once_per_bar_close)
//}


if buy
    strategy.entry("Enter Long", strategy.long)
else if sell
    strategy.entry("Enter Short", strategy.short)
- حجم ایم اے پر مبنی انکولی پرامڈائزنگ متحرک سٹاپ نقصان اور منافع لے ٹریڈنگ کی حکمت عملی
- لوڈشیلڈر باہر نکلیں
- میل مشین
- ہول لائن
- کثیر اناج کی طرف سے بیگیٹ
- وقفے کے ساتھ فبونیکی ترقی
- SUPERTREND ATR کے ساتھ ٹریلنگ سٹاپ نقصان
- الفا ٹرینڈ استعمال ایم ایف آئی
- الفا ٹرینڈ
- RSI رجحان الٹ کرنے کی حکمت عملی
- سپر بی
- اعلی کم SAR
- سپر ٹریکس
- چوٹی کا پتہ لگانے والا
- کم تلاش کرنے والا
- ایس ایم اے رجحان
- بولنگر کی کمیاں
- سپر ٹرینڈ بی
- سوئنگ ٹریڈ سگنل
- شیف رجحان سائیکل
- خرید/فروخت کے ساتھ EMA ADX RSI کا اسکیلپنگ
- حجم کا فرق
- سپر ٹرینڈ ڈیلی 2.0 BF
- ہل منتقل اوسط سوئنگ ٹریڈر
- FTSMA - رجحان آپ کا دوست ہے
- رینج فلٹر خریدیں اور فروخت کریں
- ایس ایس ایل چینل
- ہل سویٹ حکمت عملی
- پیرابولک SAR خریدیں اور فروخت کریں
- پییوٹ پر مبنی ٹریلنگ زیادہ سے زیادہ اور کم سے کم