TMA Overlay
Tác giả:ChaoZhang, Ngày: 2022-05-07 17:41:05Tags:SMA
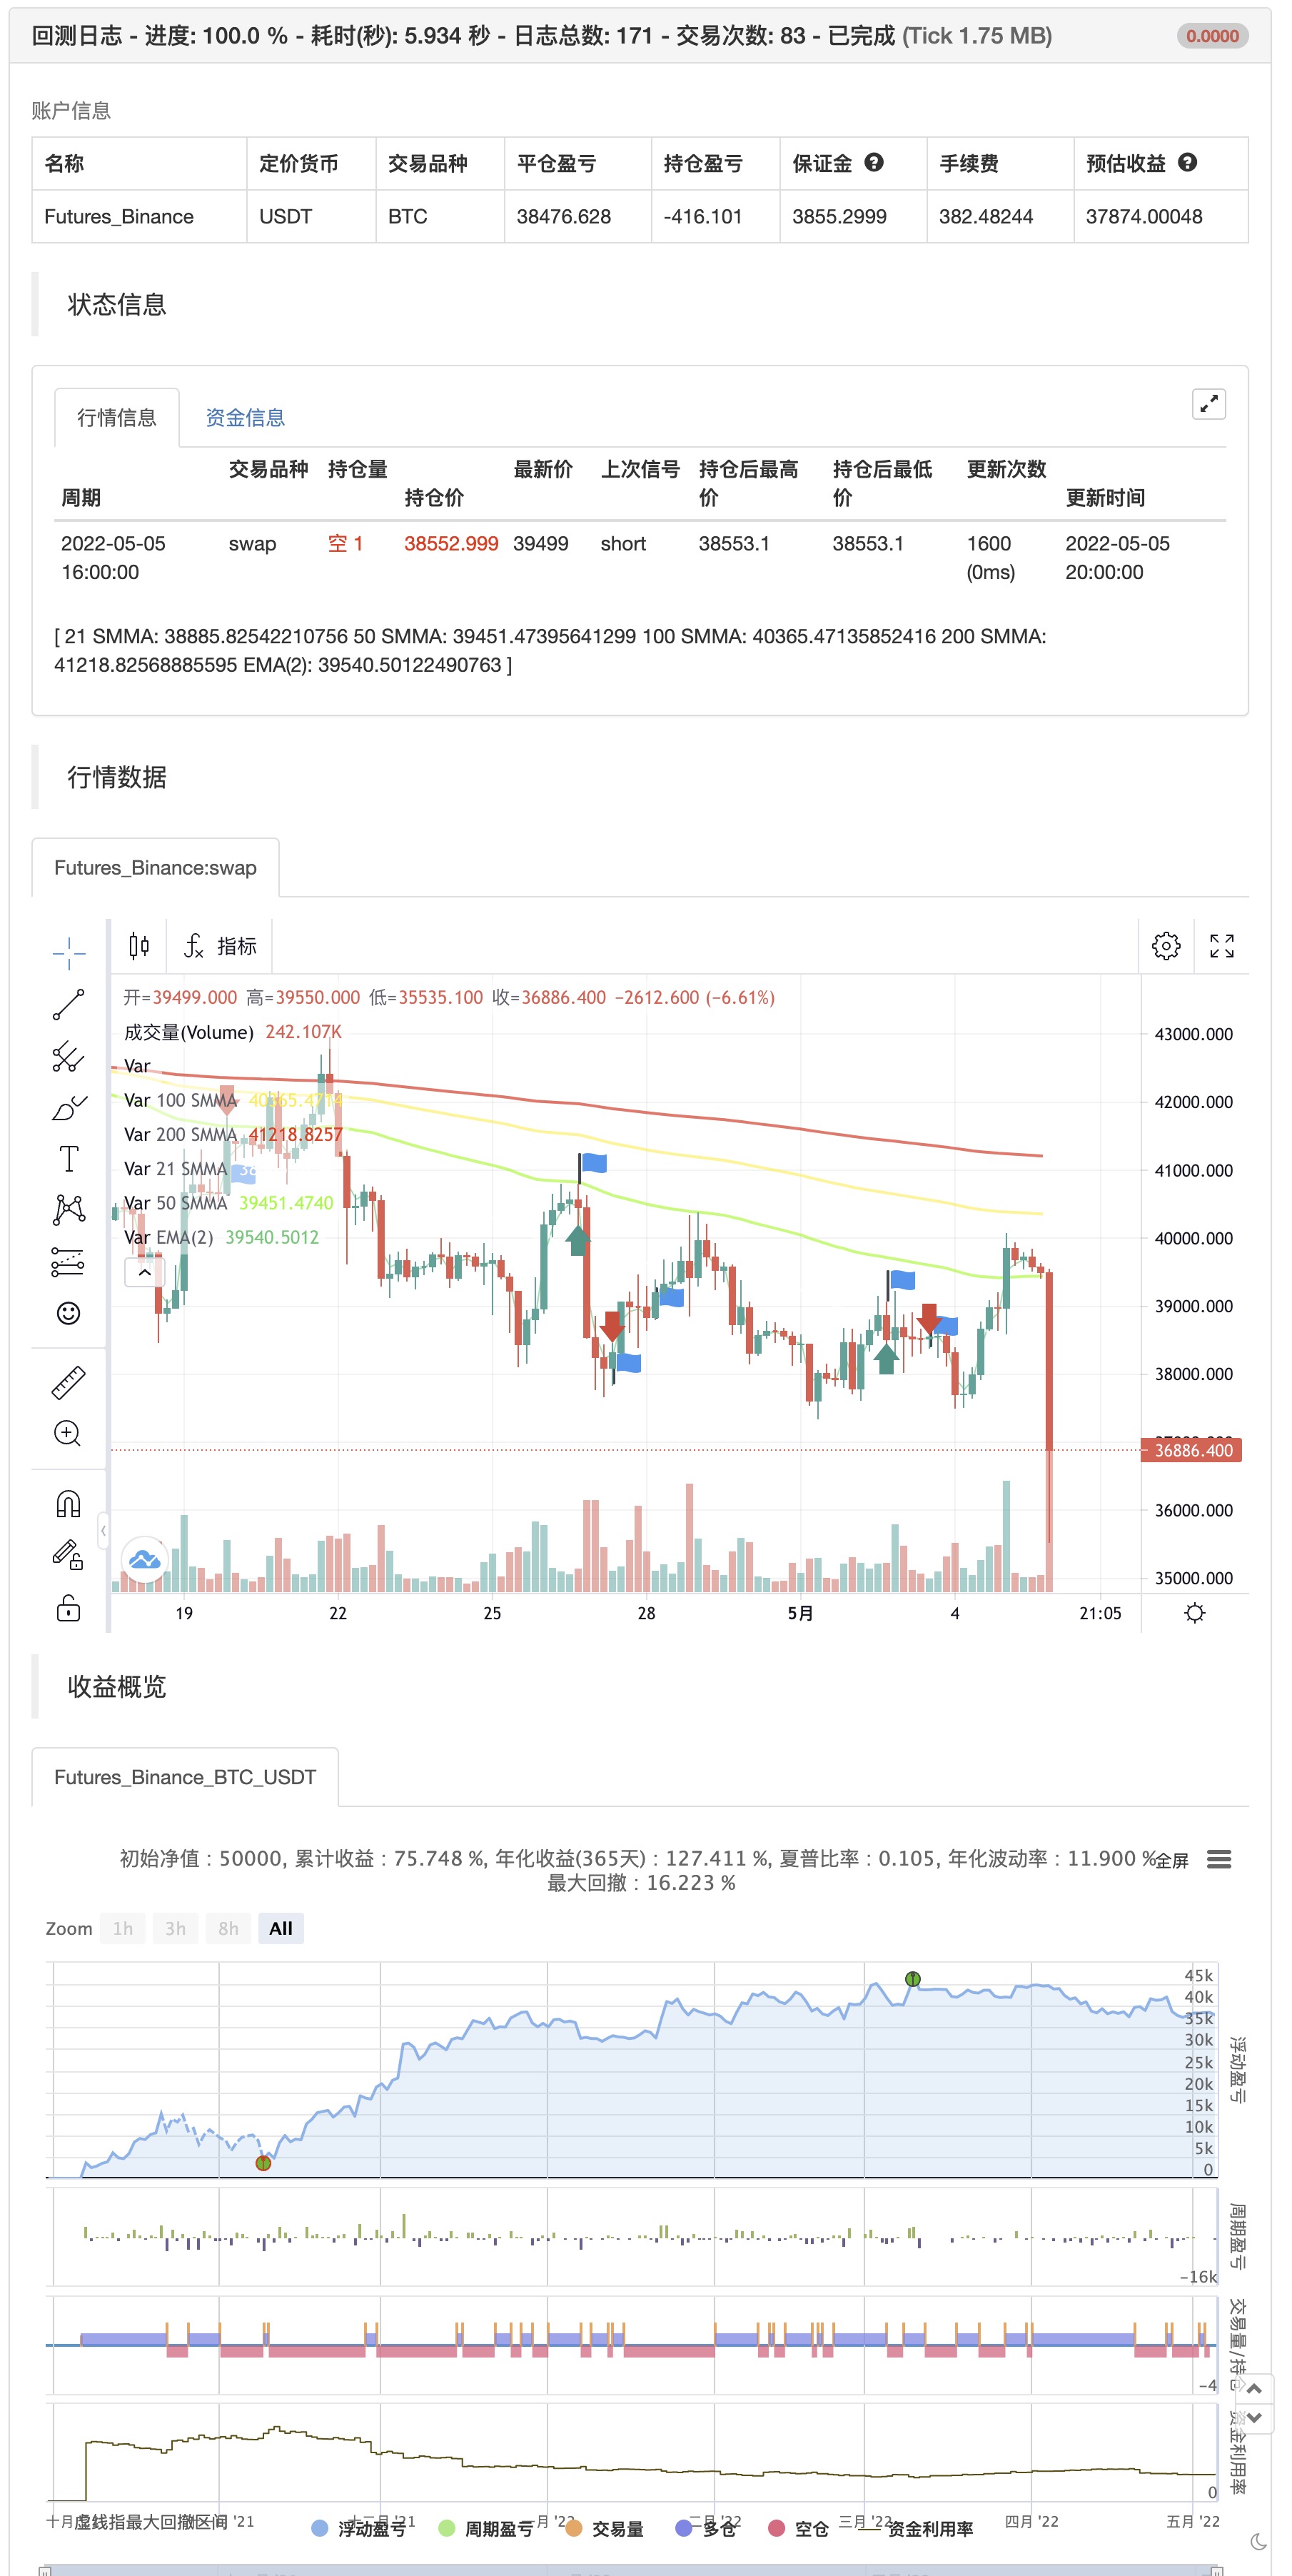
Chỉ số này giúp xác định động lượng bằng cách cung cấp một đại diện trực quan của các mẫu nến bao trùm được phủ trên với đường trung bình di chuyển trơn tru
backtest

/*backtest
start: 2021-10-01 00:00:00
end: 2022-05-05 23:59:00
period: 4h
basePeriod: 15m
exchanges: [{"eid":"Futures_Binance","currency":"BTC_USDT"}]
*/

//@version=4
study(title="TMA Overlay", shorttitle="TMA Overlay", overlay=true)

// ### Four Smoothed Moving Averages

len1 = 21
//input(21, minval=1, title="Length 1", group = "Smoothed MA Inputs")
src1 = close
//input(close, title="Source 1", group = "Smoothed MA Inputs")
smma1 = 0.0
sma_1 = sma(src1, len1)
smma1 := na(smma1[1]) ? sma_1 : (smma1[1] * (len1 - 1) + src1) / len1
plot(smma1, color=color.white, linewidth=2, title="21 SMMA")

len2 = 50
//input(50, minval=1, title="Length 2", group = "Smoothed MA Inputs")
src2 = close
//input(close, title="Source 2", group = "Smoothed MA Inputs")
smma2 = 0.0
sma_2 = sma(src2, len2)
smma2 := na(smma2[1]) ? sma_2 : (smma2[1] * (len2 - 1) + src2) / len2
plot(smma2, color=color.new(#6aff00,0), linewidth=2, title="50 SMMA")

h100 = input(title="Show 100 Line", type=input.bool, defval=true, group = "Smoothed MA Inputs")
len3 = 100
//input(100, minval=1, title="Length 3", group = "Smoothed MA Inputs")
src3 = close
//input(close, title="Source 3", group = "Smoothed MA Inputs")
smma3 = 0.0
sma_3 = sma(src3, len3)
smma3 := na(smma3[1]) ? sma_3 : (smma3[1] * (len3 - 1) + src3) / len3
sma3plot = plot(h100 ? smma3 : na, color=color.new(color.yellow,0), linewidth=2, title="100 SMMA")

len4 = 200
//input(200, minval=1, title="Length 4", group = "Smoothed MA Inputs")
src4 = close
//input(close, title="Source 4", group = "Smoothed MA Inputs")
smma4 = 0.0
sma_4 = sma(src4, len4)
smma4 := na(smma4[1]) ? sma_4 : (smma4[1] * (len4 - 1) + src4) / len4
sma4plot = plot(smma4, color=color.new(#ff0500,0), linewidth=2, title="200 SMMA")

// Trend Fill

trendFill = input(title="Show Trend Fill", type=input.bool, defval=true, group = "Smoothed MA Inputs")
ema2 = ema(close, 2)
ema2plot = plot(ema2, color=#2ecc71, transp=100, style=plot.style_line, linewidth=1, title="EMA(2)", editable = false)

//fill(ema2plot, sma4plot, color=ema2 > smma4 and trendFill ? color.green : ema2 < smma4 and trendFill ? color.red : na, transp=85, title = "Trend Fill")

// End ###

// ### 3 Line Strike

bearS = input(title="Show Bearish 3 Line Strike", type=input.bool, defval=true, group = "3 Line Strike")
bullS = input(title="Show Bullish 3 Line Strike", type=input.bool, defval=true, group = "3 Line Strike")

bearSig = close[3] > open[3] and close[2] > open[2] and close[1] > open[1] and close < open[1]
bullSig = close[3] < open[3] and close[2] < open[2] and close[1] < open[1] and close > open[1]

if bullSig
    strategy.entry("entry short", strategy.short)
else if bearSig
    strategy.entry("entry long", strategy.long)


plotshape(bullS ? bullSig : na, style=shape.triangleup, color=color.green, location=location.belowbar, size = size.small,  text="3s-Bull", title="3 Line Strike Up")
plotshape(bearS ? bearSig : na, style=shape.triangledown, color=color.red, location=location.abovebar, size = size.small,  text="3s-Bear", title="3 Line Strike Down")


// End ###
Có liên quan
- WaveTrend Cross LazyBear Chiến lược
- Chiến lược tăng cường Vegas SuperTrend
- Chiến lược giao dịch động lực chỉ số chéo stochastic
- Lý thuyết sóng Elliott 4-9 Sóng xung phát hiện tự động Chiến lược giao dịch
- Chiến lược chéo dao động Stochastic và Moving Average với Stop Loss và Stochastic Filter
- Chiến lược giao dịch biến động nội ngày có thể mở rộng
- Crossover trung bình di chuyển với chiến lược nhiều lợi nhuận
- Chiến lược bắt kịp xu hướng
- Chiến lược giao dịch định lượng dựa trên đường trung bình động và băng Bollinger
- Chiến lược Bollinger Bands Breakout
- Chiến lược thúc đẩy khung thời gian kép
Thêm nữa
- Điểm số Z với tín hiệu
- Phương pháp biến động dễ dàng của Ngôn ngữ Pine
- 3EMA + Boullinger + PIVOT
- Baguette bằng nhiều hạt
- Máy xay
- Chỉ số đảo ngược của K I
- Nến tràn ngập
- MA Hoàng đế Insiliconot
- Các điểm đảo ngược Demark
- Swing Highs / Lows & Mô hình nến
- Chiến lược MACD + SMA 200
- Hệ thống CM Sling Shot
- Bollinger + RSI, Chiến lược đôi v1.1
- Chiến lược Bollinger Bands
- Tracker xu hướng tối ưu
- Lợi nhuận hàng tháng trong các chiến lược PineScript
- ADX và DI cho v4
- MacD tùy chỉnh chỉ số - nhiều khung thời gian + Tất cả các tùy chọn có sẵn!
- Chỉ số: WaveTrend Oscillator
- Chỉ số Động lực nén