Bản đồ nhiệt theo trình tự Tom DeMark
Tác giả:ChaoZhang, Ngày: 2022-05-08 17:19:47Tags:Xu hướng
Chỉ số này sử dụng Tom DeMark's TD Sequential đếm từ 1 đến 13.
Số 9 và 13 thường xác định một xu hướng đã cạn kiệt và đánh dấu một sự đảo ngược xu hướng.
Các con số quan trọng được hiển thị dưới dạng nhãn (7-13), trong đó 9 và 13 đều được nhấn mạnh như
Bên cạnh các con số, các ngọn nến giá được tô màu dựa trên trình tự. Màu sắc tăng bắt đầu từ màu vàng sáng (TD 1 = khởi đầu xu hướng) đến màu đỏ đậm (TD 13 = xu hướng đã cạn kiệt) Màu sắc giảm bắt đầu từ màu xanh tươi sáng (TD 1 = bắt đầu xu hướng) đến màu xanh đậm (TD 13 = xu hướng đã hết)
DeMark khuyến cáo chỉ được sử dụng cho các sự đảo ngược giá ngắn hạn nhưng như bạn có thể thấy trong biểu đồ, nó cũng hoạt động cho biểu đồ LUNA 1D. Cũng hoạt động rất tốt với nến Heikin Ashi.
Sử dụng nó kết hợp với ví dụ như tỷ lệ áp suất Tom DeMark để tìm các đỉnh và đáy. Bạn có thể thay đổi khung thời gian, vô hiệu hóa nhãn / barcolor và tùy chỉnh màu sắc theo sở thích của bạn.
Nếu bạn có bất kỳ ý tưởng về cách tối ưu hóa mã, xin vui lòng cảm thấy miễn phí để chia sẻ
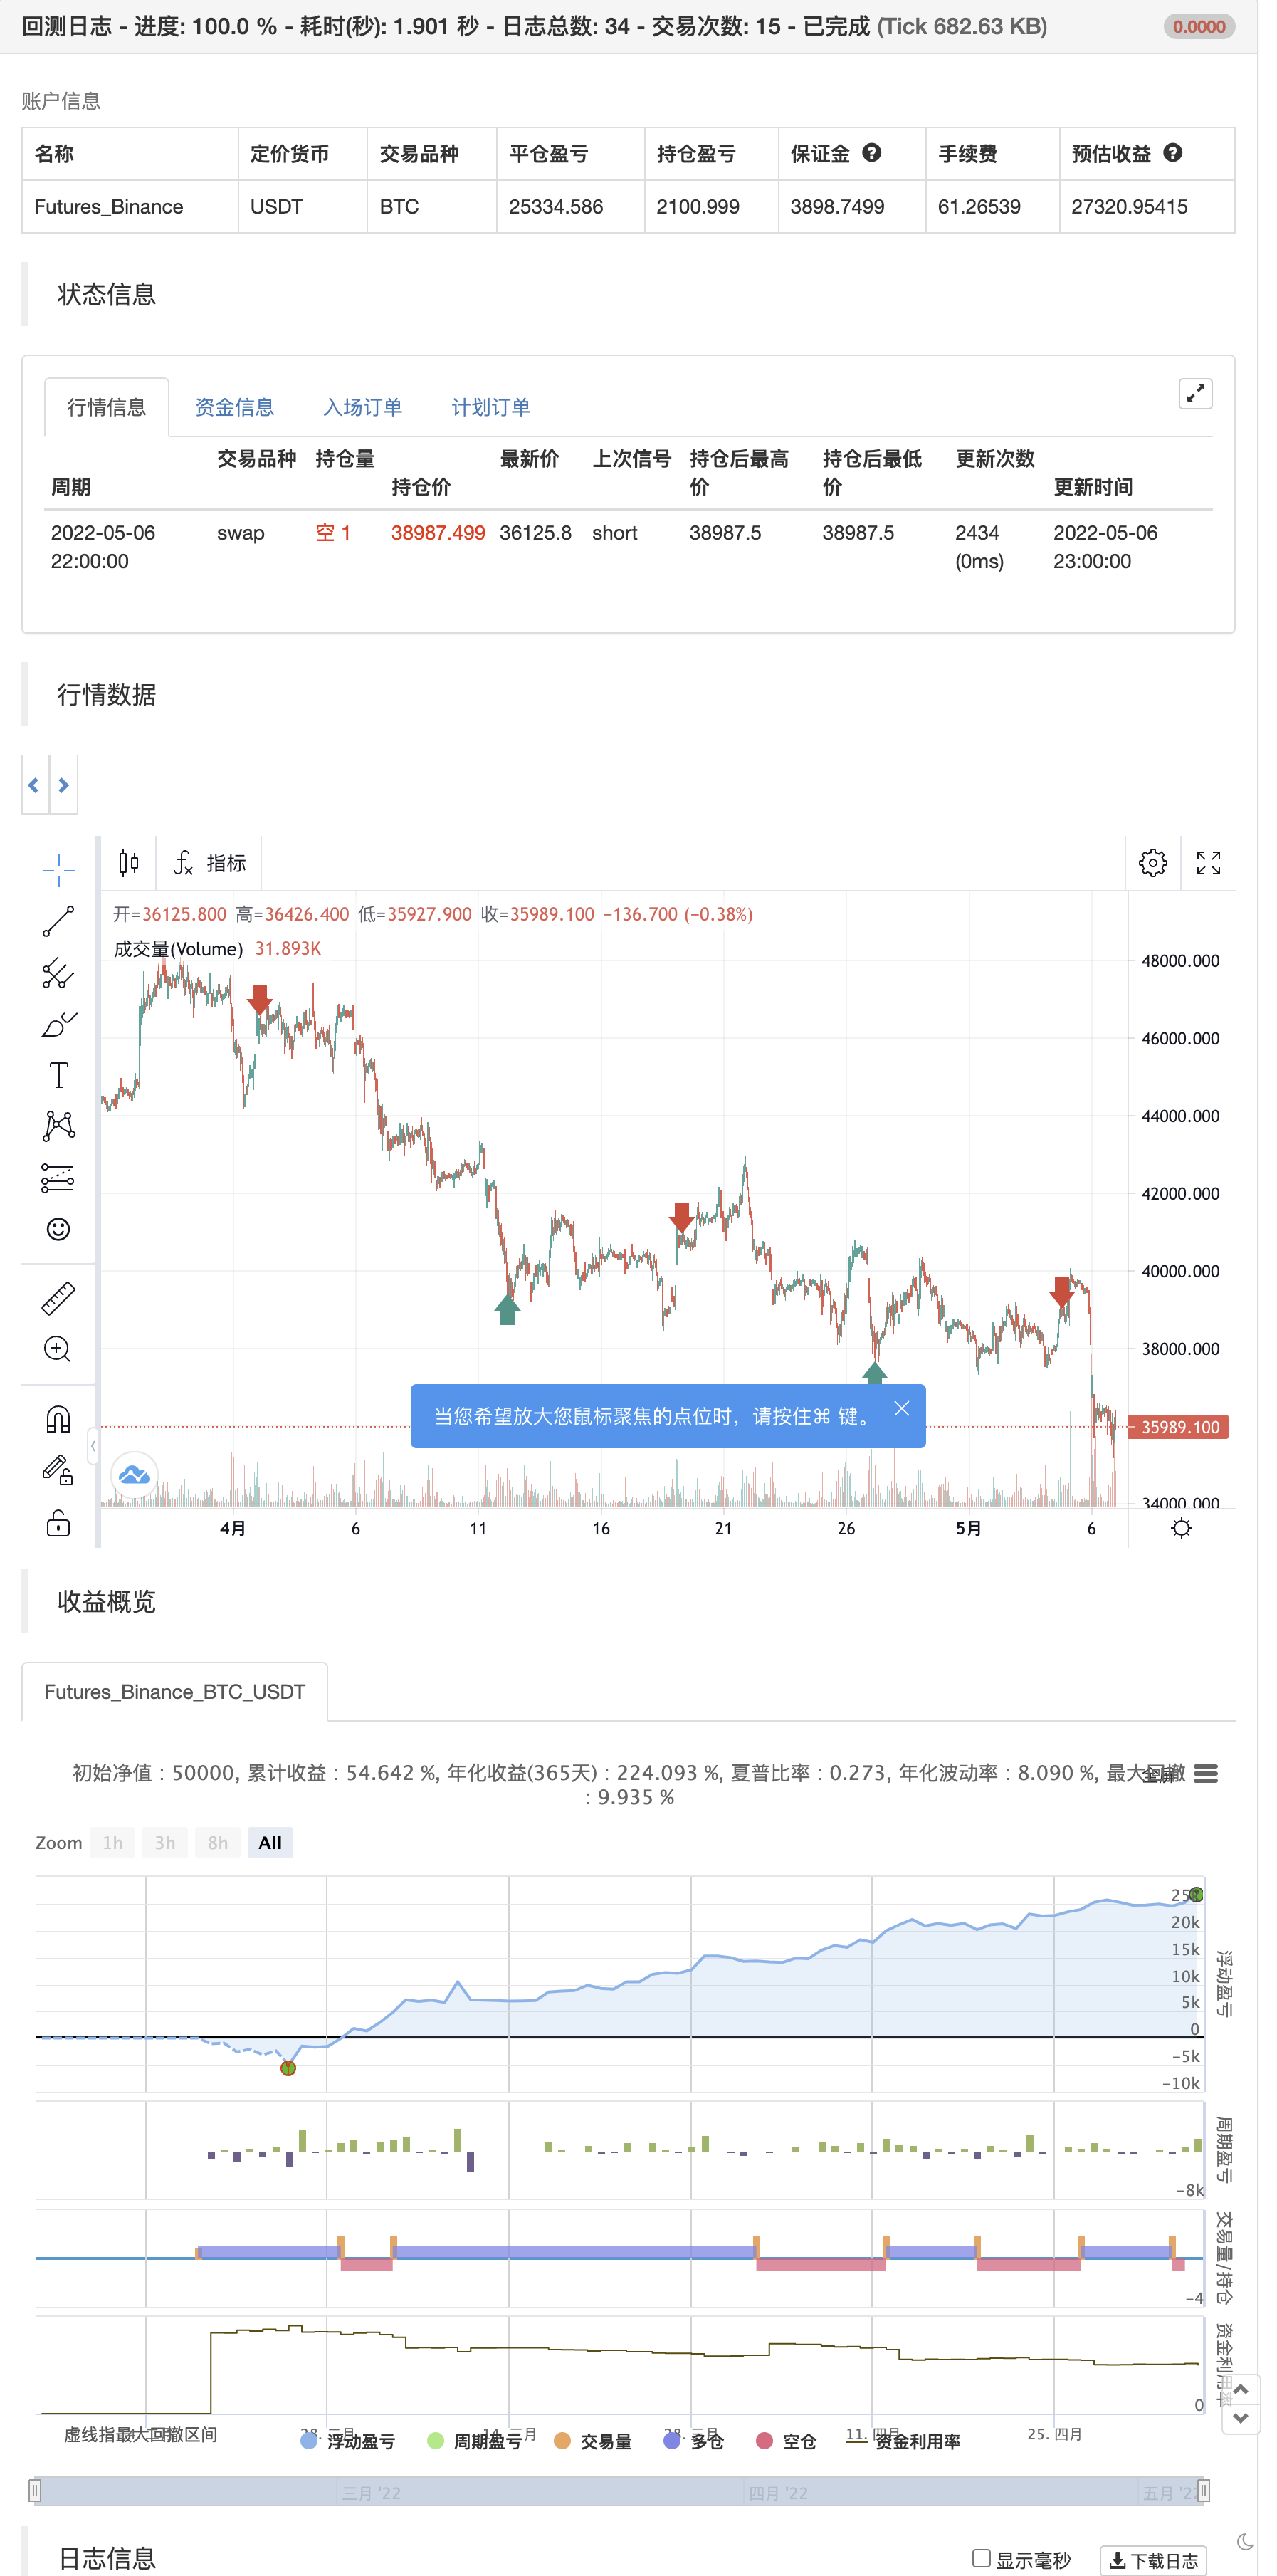
backtest
////////////////////////////////////////// Tom DeMark heatmap © by Indicator-Jones /////////////////////////////////////////
//
// This indicator uses Tom DeMark’s TD Sequential counting from 1 to 13.
// Number 9 and 13 usually identify an exhausted trend and mark trend reversal.
// The important numbers get displayed as labels (7-13), where 9 and 13 are both highlighted as "Long" or "Short".
// Besides the numbers the price candles are colored based upon the sequence.
// Bullish colors are starting from bright yellow (TD 1 = start of trend) to dark red (TD 13 = trend exhausted)
// Bearish colors are starting from bright blue (TD 1 = start of trend) to dark blue (TD 13 = trend exhausted)
//
// DeMark recommends to be used for short term price reversals only but as you can see in the chart, it also works for LUNA 1D chart.
// Also works very well with Heikin Ashi candles.
// Use it in combination with for example the "Tom DeMark Pressure Ratio" to find tops and bottoms.
// You can change the timeframes, disable lables/barcolor and customise colors to your liking.
//
// If you have any idea on how to optimise the code, please feel free to share :)
//
// Inspired by "Stochastic Heat Map" from @Violent
//
////////////////////////////////////////////////////////////////////////////////////////////////////////////////////////////

//@version=5
indicator(title='Tom DeMark Sequential Heat Map', shorttitle='TD heatmap', overlay=true, timeframe='')
//A heat map for TD counts. If you find this useful or yank the code, please consider a donation :)

// -------- Inputs --------
paintBars = input(title='Paint Bars', defval=true)
showLabels = input(title='Show labels', defval=true)

buy_col = input(#32CD32,0,'Colors',inline='col')
sell_col = input(#F44336,0,'',inline='col')
text_col = input(#FFFFFF,0,'',inline='col')


// -------- Bearish trend (blue) color selection --------
getBuyColor(count) =>
    if count == 1
        color.new(#11e7f2,0)
    else
        if count == 2
            color.new(#11d9f2,0)
        else
            if count == 3
                color.new(#11cbf2,0)
            else
                if count == 4
                    color.new(#11aff2,0)
                else
                    if count == 5
                        color.new(#1193f2,0)
                    else
                        if count == 6
                            color.new(#1176f2,0)
                        else
                            if count == 7
                                color.new(#105df4,0)
                            else
                                if count == 8
                                    color.new(#1051f5,0)
                                else
                                    if count == 9
                                        color.new(#0f44f5,0)
                                    else
                                        if count == 10
                                            color.new(#0c3de0,0)
                                        else
                                            if count == 11
                                                color.new(#0935ca,0)
                                            else
                                                if count == 12
                                                    color.new(#062eb4,0)
                                                else
                                                    if count == 13
                                                        color.new(#02269e,0)

// -------- Bullish trend (blue) color selection --------
getSellColor(count) =>
    if count == 1
        color.new(#eef211,0)
    else
        if count == 2
            color.new(#efdc11,0)
        else
            if count == 3
                color.new(#f0c511,0)
            else
                if count == 4
                    color.new(#f1af11,0)
                else
                    if count == 5
                        color.new(#f29811,0)
                    else
                        if count == 6
                            color.new(#f28811,0)
                        else
                            if count == 7
                                color.new(#f27811,0)
                            else
                                if count == 8
                                    color.new(#f26811,0)
                                else
                                    if count == 9
                                        color.new(#f25811,0)
                                    else
                                        if count == 10
                                            color.new(#ea420d,0)
                                        else
                                            if count == 11
                                                color.new(#e12c09,0)
                                            else
                                                if count == 12
                                                    color.new(#d81605,0)
                                                else
                                                    if count == 13
                                                        color.new(#cf0000,0)

// -------- Calculate bearish trend sequence --------
buySetup = 0
buySetup := close < close[4] ? buySetup[1] == 13 ? 1 : buySetup[1] + 1 : 0


// -------- Calculate bullish trend sequence --------
sellSetup = 0
sellSetup := close > close[4] ? sellSetup[1] == 13 ? 1 : sellSetup[1] + 1 : 0


// -------- Paint bars --------
barColour = buySetup >= 1 ? getBuyColor(buySetup) : sellSetup >= 1 ? getSellColor(sellSetup) : na
//barcolor(paintBars ? barColour : na, title='Bar colors (heatmap)')


if buySetup == 13
    strategy.entry("Enter Long", strategy.long)
else if sellSetup == 13
    strategy.entry("Enter Short", strategy.short)
- Xu hướng tuyến tính
- Mô hình thời gian Fibonacci
- Xu hướng chuyển động
- siêu xu hướng B
- KijunSen Line với Cross
- Xu hướng kim cương
- Động lực 2.0
- Xu hướng Heikin-Ashi
- Các điểm đảo ngược Demark
- Một đường thẳng xu hướng Demo
- RSI MTF Ob+Os
- Chiến lược MACD Willy
- RSI - Bán tín hiệu mua
- Xu hướng Heikin-Ashi
- HA Xấu đảo thị trường
- Ichimoku Cloud Smooth Oscillator
- Williams %R - Đơn giản hóa
- QQE MOD + SSL Hybrid + Waddah Attar vụ nổ
- Mua/Bán Strat
- Triple Supertrend với EMA và ADX
- jma + dwma bằng nhiều hạt
- MACD MAGIC
- Điểm số Z với tín hiệu
- Phương pháp biến động dễ dàng của Ngôn ngữ Pine
- 3EMA + Boullinger + PIVOT
- Baguette bằng nhiều hạt
- Máy xay
- Chỉ số đảo ngược của K I
- Nến tràn ngập
- MA Hoàng đế Insiliconot