Điểm trục cao thấp nhiều khung thời gian
Tác giả:ChaoZhang, Ngày: 2022-05-16 15:12:10Tags:Trục
Xin chào mọi người.
Có tích hợp và xuất bản các chỉ số Pivot Point High Low trong Thư viện công cộng nhưng theo tôi thấy không một trong số đó là cho khung thời gian cao hơn. vì vậy tôi quyết định viết và xuất bản kịch bản này. Tôi hy vọng nó sẽ hữu ích trong khi giao dịch hoặc phát triển kịch bản của riêng bạn. Tôi cũng đã làm điều này để sử dụng trong một trong những dự án trong tương lai của tôi (chúng tôi sẽ thấy nó trong vài tuần / tháng ;)).
Tôi đã cố gắng làm cho tất cả các thiết lập tùy chọn, để bạn có thể chơi với chúng như bạn muốn.
PS: Không có cơ chế kiểm soát nếu khung thời gian biểu đồ thấp hơn khung thời gian trong các tùy chọn. vì vậy bạn nên đặt khung thời gian cao hơn trong các tùy chọn hơn khung thời gian biểu đồ.
Thưởng thức đi!
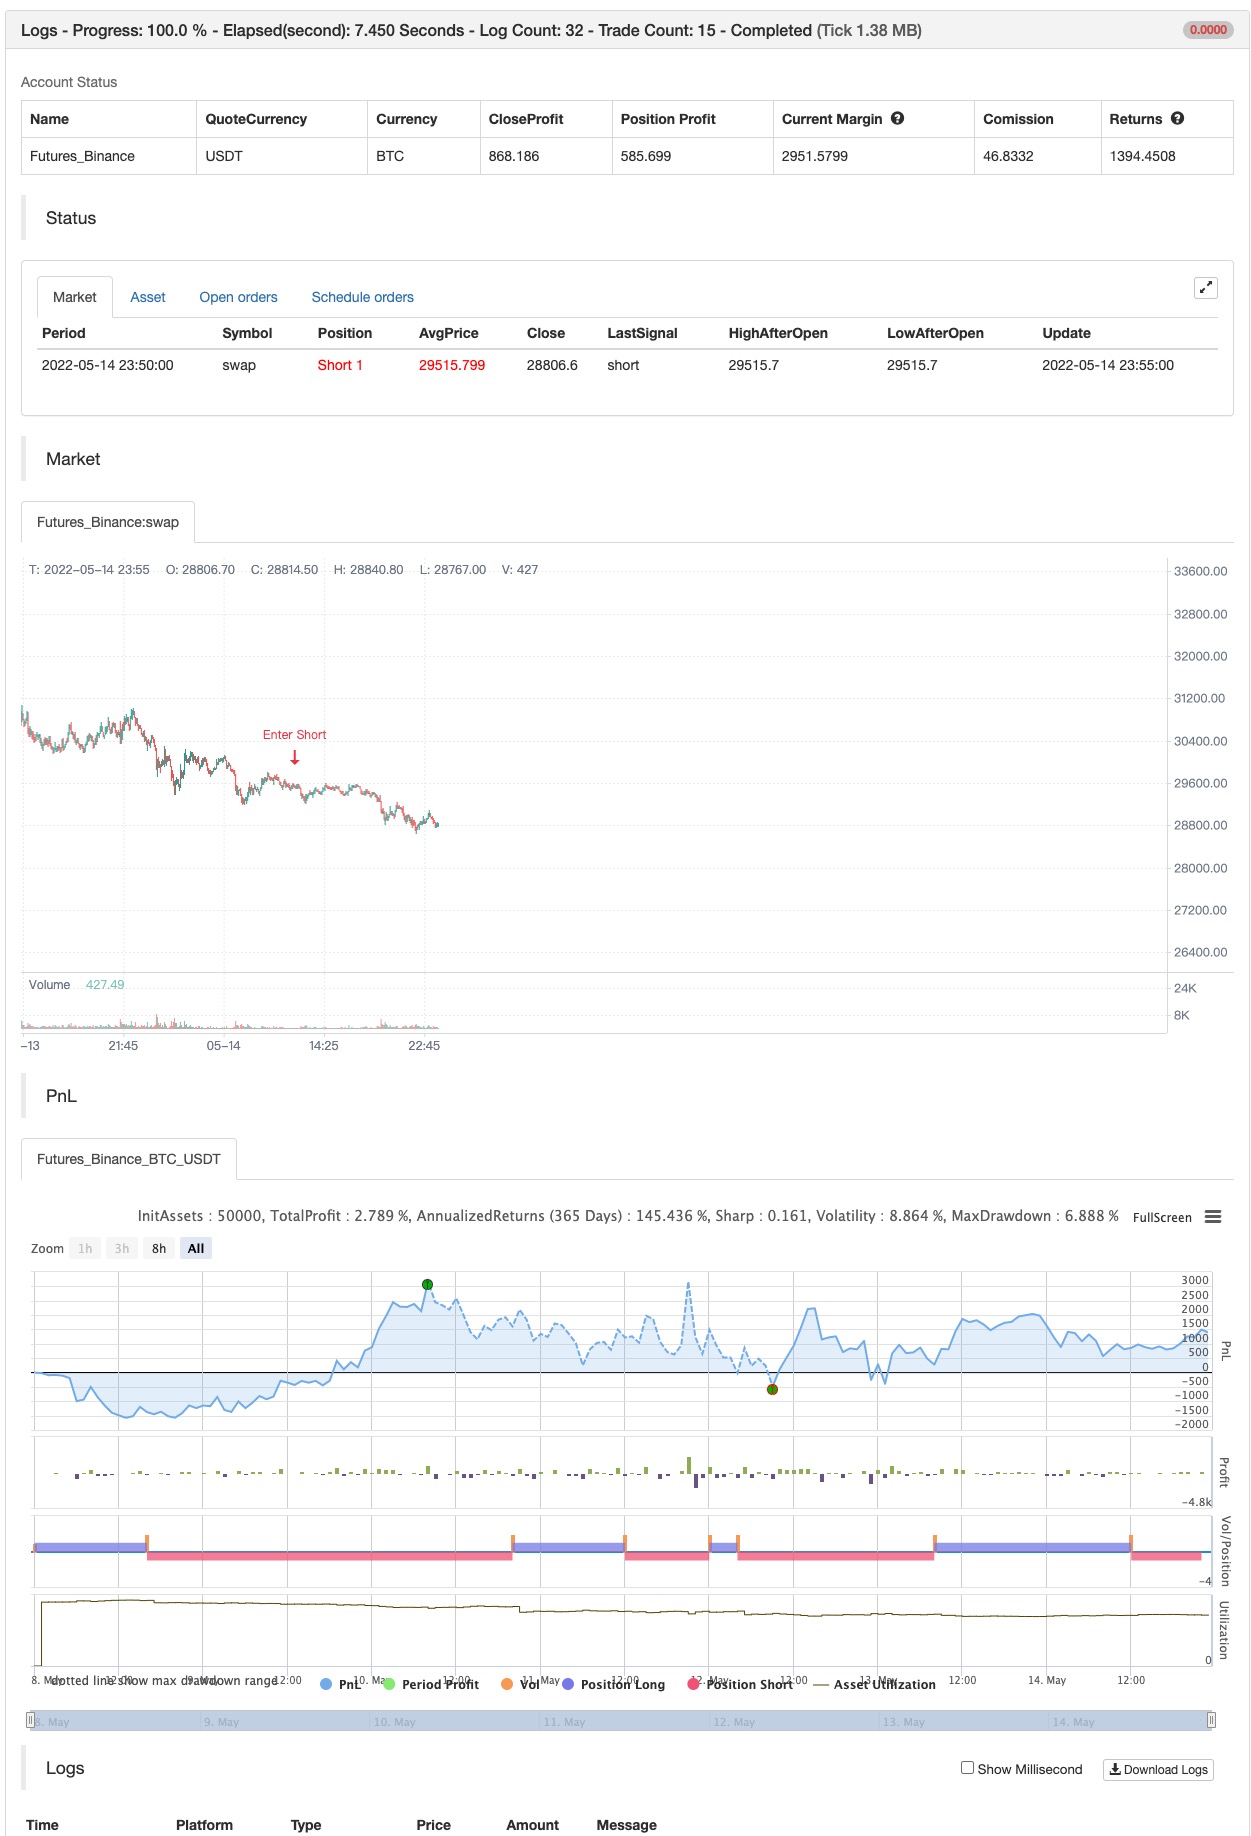
backtest
/*backtest
start: 2022-05-08 00:00:00
end: 2022-05-14 23:59:00
period: 5m
basePeriod: 1m
exchanges: [{"eid":"Futures_Binance","currency":"BTC_USDT"}]
*/

// This source code is subject to the terms of the Mozilla Public License 2.0 at https://mozilla.org/MPL/2.0/
// © LonesomeTheBlue

//@version=5
indicator("Pivot Points High Low Multi Time Frame", overlay = true, max_lines_count = 500, max_labels_count = 500)
timeframe = input.timeframe(defval = '240')
leftBars  = input.int(defval = 2, title = "Left Bars", minval = 1)
rightBars  = input.int(defval = 2, title = "Right Bars", minval = 1)
phlinecol = input(defval = color.lime, title = "Pivot High/Low Line Colors", inline = "lc")
pllinecol = input(defval = color.red, title = "", inline = "lc")
phbgcol = input(defval = color.lime, title = "Pivot High BG/Text Colors", inline = "ph")
phtextcol = input(defval = color.black, title = "", inline = "ph")
plbgcol = input(defval = color.red, title = "Pivot Low BG/Text Colors", inline = "pl")
pltextcol = input(defval = color.white, title = "", inline = "pl")

get_phpl()=>
    float ph = ta.pivothigh(leftBars, rightBars)
    float pl = ta.pivotlow(leftBars, rightBars)
    phtimestart = ph ? time[rightBars] : na
    phtimeend = ph ? time[rightBars - 1] : na
    pltimestart = pl ? time[rightBars] : na
    pltimeend = pl ? time[rightBars - 1] : na

    [ph, phtimestart, phtimeend, pl, pltimestart, pltimeend]

// get if there if Pivot High/low and their start/end times
[ph, phtimestart, phtimeend, pl, pltimestart, pltimeend] = request.security(syminfo.tickerid, timeframe, get_phpl(), lookahead = barmerge.lookahead_on)

// keep time of each bars, this is used for lines/labels
var mytime = array.new_int(0)
array.unshift(mytime, time)

// calculate end of the line/time for pivot high/low
bhend = array.get(mytime, math.min(array.indexof(mytime, phtimeend) + 1, array.size(mytime) - 1))
blend = array.get(mytime, math.min(array.indexof(mytime, pltimeend) + 1, array.size(mytime) - 1))

// to draw once
float pivothigh = na(ph[1]) and ph ? ph : na
float pivotlow  = na(pl[1]) and pl ? pl : na


if not na(pivothigh)
    strategy.entry("Enter Long", strategy.long)
else if not na(pivotlow)
    strategy.entry("Enter Short", strategy.short)
- Chỉ số RSI Divergence
- Xu hướng chuyển động
- Sự khác biệt về khối lượng
- Tiêu chí tối đa và tối thiểu dựa trên pivot
- Điểm trung tâm siêu xu hướng
- Chiến lược siêu xu hướng Villa Dynamic Pivot
- Các khối thứ tự trục trục
- Lợi nhuận hàng tháng trong các chiến lược PineScript
- Sma BTC killer
- Mẫu cảnh báo ML
- Tiến trình Fibonacci với các đoạn phá vỡ
- RSI MTF Ob+Os
- Fukuiz Octa-EMA + Ichimoku
- CCI MTF Ob+Os
- MACD thông minh hơn
- Chiến lược của OCC R5.1
- Chào mừng bạn đến chợ gấu.
- Sidboss
- Phantom Trends theo dõi cơ sở dữ liệu chiến lược
- Phantom Trends theo dõi các cơ sở kinh doanh chiến lược
- Chiến lược theo dõi xu hướng ma
- Rainbow Oscillator
- Thương mại đường cong vốn chủ sở hữu ví dụ về kích thước vị trí
- KLineChart Demo
- Chiến lược siêu xu hướng Villa Dynamic Pivot
- Crodl's Supertrend
- RSI của zdmre
- FTL - Range Filter X2 + EMA + UO