Tỷ lệ năng lượng hướng tăng tốc theo khối lượng RedK
Tác giả:ChaoZhang, Ngày: 2022-05-18 15:21:57Tags:EMASMAWMA
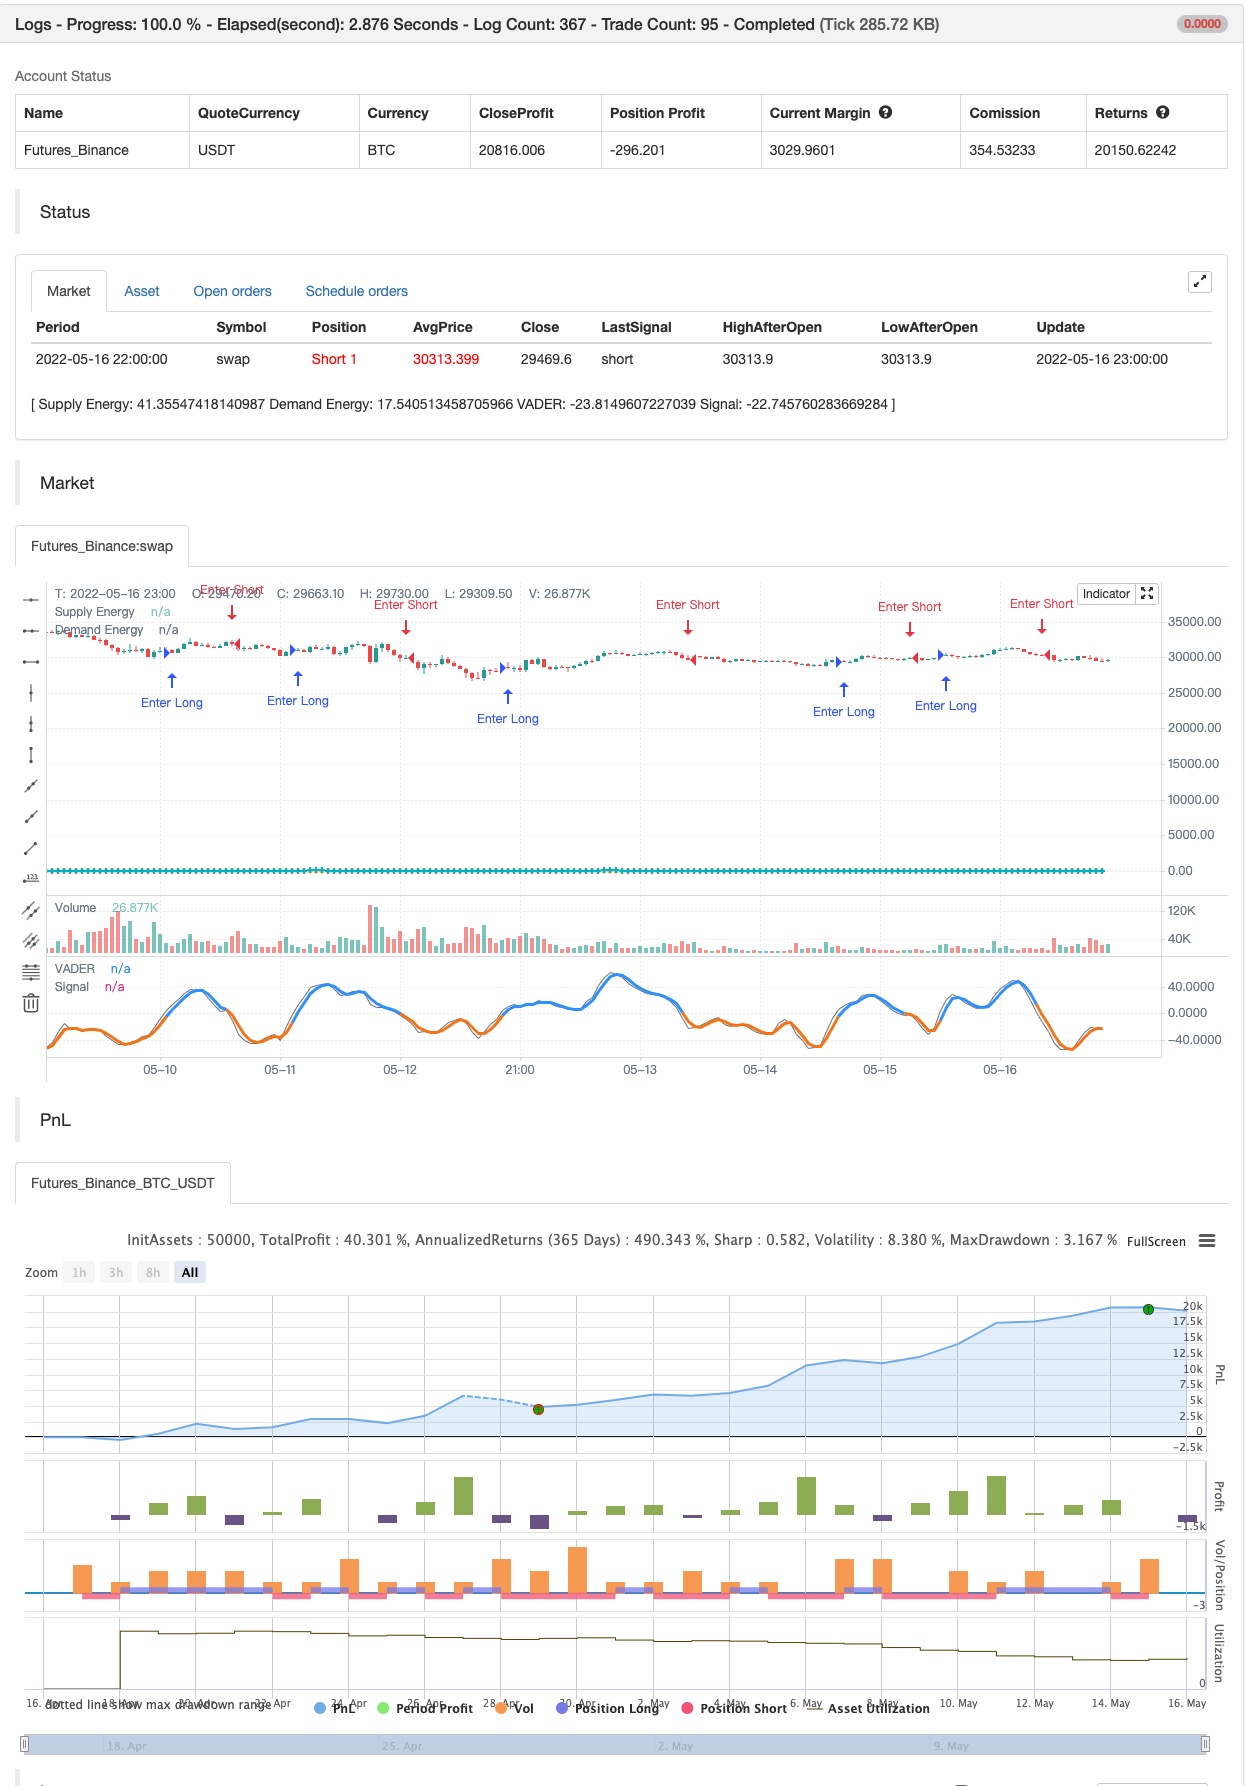
Tỷ lệ năng lượng hướng tăng tốc khối lượng (VADER) sử dụng các biến động giá (sự dịch chuyển) và khối lượng liên quan (nỗ lực) để ước tính tích cực (mua) và tiêu cực (bán)
VADER hoạt động như thế nào?
Tôi luôn luôn là một người hâm mộ của các khái niệm phân tích kỹ thuật đơn giản, và tích hợp cả hành động giá và khối lượng với nhau - Khái niệm đằng sau VADER thực sự là một đơn giản.
Chúng ta hãy đi bộ qua nó để tránh quá kỹ thuật: Di chuyển giá lớn liên quan đến khối lượng lớn có nghĩa là người mua (nếu chuyển động tăng) hoặc người bán (nếu chuyển động giảm) là nghiêm túc và đang kiểm soát hành động Mặt khác, khi các chuyển động giá nhỏ nhưng với khối lượng lớn, điều đó có nghĩa là có một cuộc chiến, hoặc nhiều hơn là sự cân bằng năng lượng, giữa mua và bán. Ngoài ra, khi chuyển động giá lớn liên quan đến khối lượng tương đối hạn chế, có sự thiếu hụt năng lượng từ người mua hoặc người bán - và các chuyển động như vậy thường ngắn ngủi.
Sự tương tự với VADER, là chúng ta xem các chuyển động giá (thay đổi của đóng giữa 2 thanh) như là sự dịch chuyển (hoặc kết quả hành động) và khối lượng liên quan như là nỗ lực đằng sau hành động này Kết hợp hai giá trị này với nhau, sự dịch chuyển và nỗ lực, cho chúng ta một đại diện hoặc một đại diện của năng lượng cơ bản (trong một hướng cụ thể). khi cả hai giá trị (sự dịch chuyển và nỗ lực) cao, thì năng lượng kết quả là cao - và nếu một trong những giá trị này thấp, năng lượng kết quả là thấp.
sau đó chúng ta lấy một trung bình của năng lượng tương đối đó trong mỗi hướng (tích cực = mua và âm = bán) và tính năng lượng ròng.
lưu ý rằng chúng ta đang tiếp cận sự tương đồng ở đây từ quan điểm giao dịch và không phải từ quan điểm vật lý:)
backtest
/*backtest
start: 2022-04-17 00:00:00
end: 2022-05-16 23:59:00
period: 1h
basePeriod: 15m
exchanges: [{"eid":"Futures_Binance","currency":"BTC_USDT"}]
*/

// This source code is subject to the terms of the Mozilla Public License 2.0 at https://mozilla.org/MPL/2.0/
// © RedKTrader

//@version=5
indicator('RedK Volume-Accelerated Directional Energy Ratio', 'RedK VADER v3.0', precision=0, timeframe='', timeframe_gaps=false)

// ***********************************************************************************************************
// Choose volume calculation method.. Relative vs full.
// Relative magnifies effect of recent volume spikes (up or down)
f_RelVol(_value, _length) =>
    min_value = ta.lowest(_value, _length)
    max_value = ta.highest(_value, _length)
    ta.stoch(_value, max_value, min_value, _length) / 100
// ***********************************************************************************************************

// ***********************************************************************************************************
// Choose MA type for the base DER calculation ..
// WMA is my preference and is default .. SMA is really slow and lags a lot - but added for comparison
f_derma(_data, _len, MAOption) =>
    value =
      MAOption == 'SMA' ? ta.sma(_data, _len) :
      MAOption == 'EMA' ? ta.ema(_data, _len) :
      ta.wma(_data, _len)
// ***********************************************************************************************************


// ===========================================================================================================
//      Inputs
// ===========================================================================================================

price   = close
length  = input.int(9, minval=1)
DER_avg = input.int(5, 'Average', minval=1, inline='DER', group='Directional Energy Ratio')
MA_Type = input.string('WMA', 'DER MA type', options=['WMA', 'EMA', 'SMA'], inline='DER', group='Directional Energy Ratio')
smooth  = input.int(3, 'Smooth', minval=1,  inline='DER_1', group='Directional Energy Ratio')

show_senti = input.bool(false, 'Sentiment',  inline='DER_s', group='Directional Energy Ratio')
senti   = input.int(20, 'Length', minval=1, inline='DER_s', group='Directional Energy Ratio')


v_calc  = input.string('Relative', 'Calculation', options=['Relative', 'Full', 'None'], group='Volume Parameters')
vlookbk = input.int(10, 'Lookback (for Relative)', minval=1,                            group='Volume Parameters')

// ===========================================================================================================
//          Calculations
// ===========================================================================================================

// Volume Calculation Option  -- will revert to no volume acceleration for instruments with no volume data
vola    =
  v_calc == 'None' or na(volume) ? 1 :
  v_calc == 'Relative' ? f_RelVol(volume, vlookbk) :
  volume

R       = (ta.highest(2) - ta.lowest(2)) / 2                    // R is the 2-bar average bar range - this method accomodates bar gaps
sr      = ta.change(price) / R                                  // calc ratio of change to R
rsr     = math.max(math.min(sr, 1), -1)                         // ensure ratio is restricted to +1/-1 in case of big moves
c       = fixnan(rsr * vola)                                    // add volume accel -- fixnan adresses cases where no price change between bars

c_plus  = math.max(c, 0)                                        // calc directional vol-accel energy
c_minus = -math.min(c, 0)

// plot(c_plus)
// plot(c_minus)


avg_vola    = f_derma(vola, length, MA_Type)
dem         = f_derma(c_plus, length, MA_Type)  / avg_vola          // directional energy ratio
sup         = f_derma(c_minus, length, MA_Type) / avg_vola

adp         = 100 * ta.wma(dem, DER_avg)                            // average DER
asp         = 100 * ta.wma(sup, DER_avg)
anp         = adp - asp                                             // net DER..
anp_s       = ta.wma(anp, smooth)

// Calculate Sentiment - a VADER for a longer period and can act as a baseline (compared to a static 0 value)
// note we're not re-calculating vol_avg, demand or supply energy for sentiment. this would've been a different approach
s_adp       = 100 * ta.wma(dem, senti)                            // average DER for sentiment length
s_asp       = 100 * ta.wma(sup, senti)
V_senti     = ta.wma(s_adp - s_asp, smooth)


// ===========================================================================================================
//      Colors & plots
// ===========================================================================================================
c_adp   = color.new(color.aqua, 30)
c_asp   = color.new(color.orange, 30)
c_fd    = color.new(color.green, 80)
c_fs    = color.new(color.red, 80)
c_zero  = color.new(#ffee00, 70)

c_up    = color.new(#359bfc, 0)
c_dn    = color.new(#f57f17, 0)

c_sup   = color.new(#33ff00, 80)
c_sdn   = color.new(#ff1111, 80)
up      = anp_s >= 0
s_up    = V_senti >=0

hline(0, 'Zero Line', c_zero, hline.style_solid)

// =============================================================================
// v3.0 --- Sentiment will be represented as a 4-color histogram
c_grow_above = #1b5e2080
c_grow_below = #dc4c4a80
c_fall_above = #66bb6a80
c_fall_below = #ef8e9880

sflag_up = math.abs(V_senti) >= math.abs(V_senti[1])

plot(show_senti ? V_senti : na, "Sentiment", style=plot.style_columns,
 color = s_up ? (sflag_up ? c_grow_above : c_fall_above) :
 sflag_up ? c_grow_below : c_fall_below)
// =============================================================================

s = plot(asp, 'Supply Energy', c_asp, 2, style=plot.style_circles,  join=true)
d = plot(adp, 'Demand Energy', c_adp, 2, style=plot.style_cross,    join=true)
fill(d, s, adp > asp ? c_fd : c_fs)

plot(anp, 'VADER', color.new(color.gray, 30), display=display.none)
plot(anp_s, 'Signal', up ? c_up : c_dn, 3)

// ===========================================================================================================
//      v2.0 adding alerts
// ===========================================================================================================

Alert_up    = ta.crossover(anp_s,0)
Alert_dn    = ta.crossunder(anp_s,0)
Alert_swing = ta.cross(anp_s,0)

// "." in alert title for the alerts to show in the right order up/down/swing
alertcondition(Alert_up,    ".   VADER Crossing 0 Up",      "VADER Up - Buying Energy Detected!")
alertcondition(Alert_dn,    "..  VADER Crossing 0 Down",    "VADER Down - Selling Energy Detected!")
alertcondition(Alert_swing, "... VADER Crossing 0",         "VADER Swing - Possible Reversal")

// ===========================================================================================================
//      v3.0 more alerts for VADER crossing Sentiment
// ===========================================================================================================

v_speedup = ta.crossover(anp_s, V_senti)
v_slowdn  = ta.crossunder(anp_s, V_senti)
alertcondition(v_speedup,   "*  VADER Speeding Up",      "VADER Speeding Up!")
alertcondition(v_slowdn,    "** VADER Slowing Down",    "VADER Slowing Down!")


if Alert_up
    strategy.entry("Enter Long", strategy.long)
else if Alert_dn
    strategy.entry("Enter Short", strategy.short)
- RedK Dual VADER với thanh năng lượng
- Chiến lược giao dịch định lượng dựa trên đường trung bình động và băng Bollinger
- Cảnh báo chéo trung bình chuyển động, nhiều khung thời gian (MTF)
- HALFTREND + HEMA + SMA (Chiến lược tín hiệu sai)
- Rainbow Oscillator
- RedK Momentum Bars
- ESSMA
- Super Scalper
- SuperJump quay lại Bollinger Band
- MACD thông minh hơn
- Order Block Finder
- TrendScalp-FractalBox-3EMA
- Các tín hiệu QQE
- Lưu ý:
- CM MACD Chỉ số tùy chỉnh - Khung thời gian đa - V2
- HODL LINE
- 2 Phát hiện hướng màu trung bình chuyển động
- Scalping PullBack Tool R1
- Chiến lược mua&bán phụ thuộc vào AO+Stoch+RSI+ATR
- EMA TREND CLOUD
- Donchian Breakout không sơn lại
- RedK Momentum Bars
- SuperJump quay lại Bollinger Band
- Xu hướng Fukuiz
- Bốt của Johnny.
- SSL lai
- Cửa ra đèn chùm
- RISOTTO
- Chiến lược trong ngày của EMA
- Điểm trung tâm siêu xu hướng