Đường trung bình di chuyển siêu xu hướng
Tác giả:ChaoZhang, Ngày: 2022-05-23 16:49:20Tags:SMAEMAWMADEMATMAATR
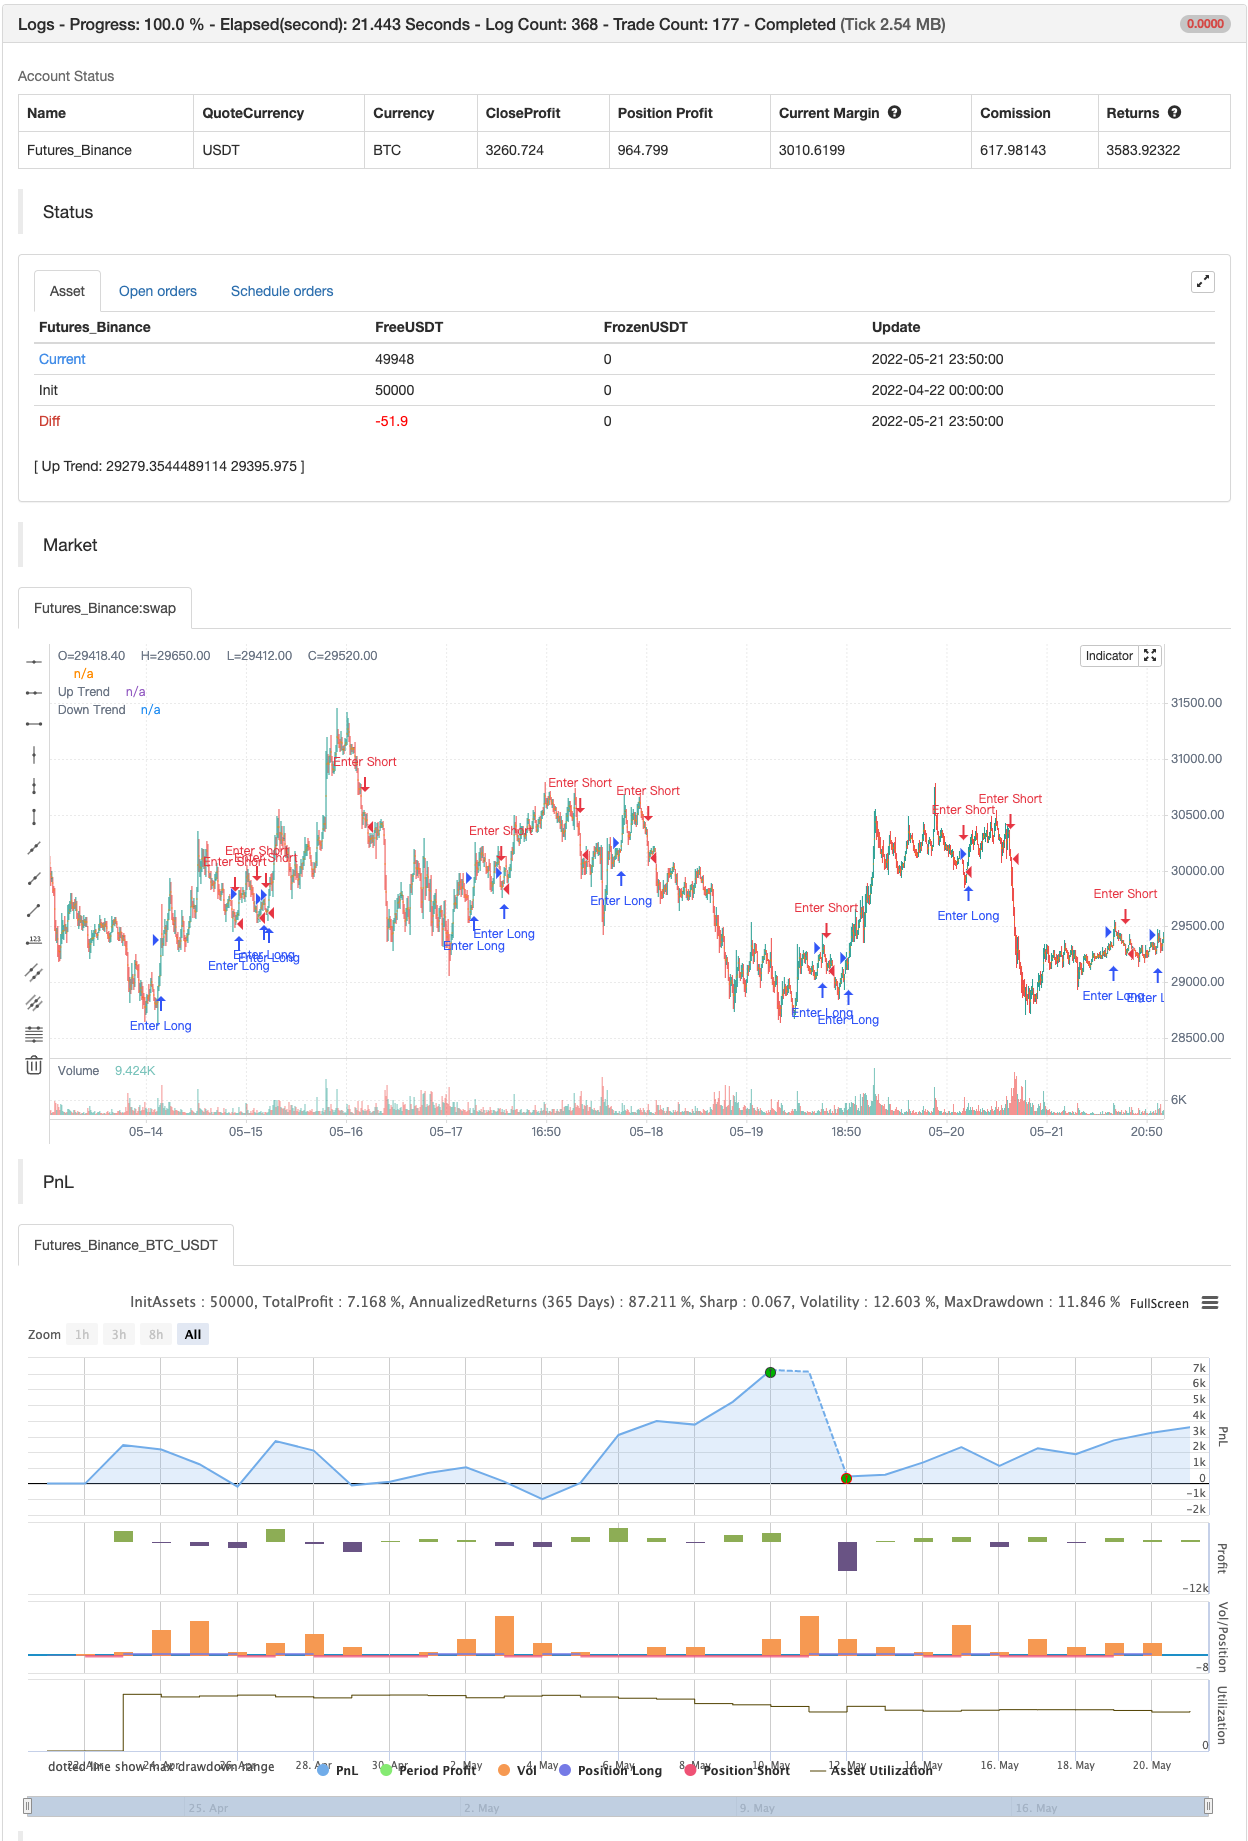
thêm 100 giai đoạn Tỷ lệ trung bình chuyển động nhân trong tính toán của SuperTrend và cũng là 0.5 ATR Multiplier để có một cái nhìn rõ ràng về xu hướng đang diễn ra và cũng cung cấp các hỗ trợ và kháng cự đáng kể.
Loại trung bình di chuyển mặc định được đặt là EMA (Trung bình di chuyển theo cấp số) nhưng người dùng có thể chọn từ 11 loại trung bình di chuyển khác nhau như:
SMA: Mức trung bình di chuyển đơn giản EMA: Chỉ số trung bình di chuyển theo cấp số WMA: Trung bình di chuyển cân nhắc DEMA: Đường trung bình di chuyển hàm số hai TMA: Trung bình di chuyển tam giác VAR: Chỉ số biến động Đường trung bình động còn được gọi là VIDYA WWMA: Welles Wilder's Moving Average ZLEMA: Trung bình di chuyển theo hàm số không trễ TSF: Sức mạnh thực sự HULL: Hull Moving Average TILL: Tillson T3 Moving Average
Nhận tín dụng cho @CryptoErge vì đã chia sẻ phát triển của mình với công chúng.
backtest
/*backtest
start: 2022-04-22 00:00:00
end: 2022-05-21 23:59:00
period: 10m
basePeriod: 1m
exchanges: [{"eid":"Futures_Binance","currency":"BTC_USDT"}]
*/

//@version=5

indicator('SuperTrended Moving Averages', 'ST MA', overlay=true, format=format.price, precision=2, timeframe='', timeframe_gaps=false)
src = input(close, title='Source')
mav = input.string(title='Moving Average Type', defval='EMA', options=['SMA', 'EMA', 'WMA', 'DEMA', 'TMA', 'VAR', 'WWMA', 'ZLEMA', 'TSF', 'HULL', 'TILL'])
length = input.int(100, 'Moving Average Length', minval=1)
Periods = input(title='ATR Period', defval=10)
Multiplier = input.float(title='ATR Multiplier', step=0.1, defval=0.5)
changeATR = input(title='Change ATR Calculation Method ?', defval=true)
showsignals = input(title='Show Buy/Sell Signals ?', defval=false)
highlighting = input(title='Highlighter On/Off ?', defval=true)


T3a1 = input.float(0.7, 'TILLSON T3 Volume Factor', step=0.1)


Var_Func(src, length) =>
    valpha = 2 / (length + 1)
    vud1 = src > src[1] ? src - src[1] : 0
    vdd1 = src < src[1] ? src[1] - src : 0
    vUD = math.sum(vud1, 9)
    vDD = math.sum(vdd1, 9)
    vCMO = nz((vUD - vDD) / (vUD + vDD))
    VAR = 0.0
    VAR := nz(valpha * math.abs(vCMO) * src) + (1 - valpha * math.abs(vCMO)) * nz(VAR[1])
    VAR
VAR = Var_Func(src, length)
DEMA = 2 * ta.ema(src, length) - ta.ema(ta.ema(src, length), length)
Wwma_Func(src, length) =>
    wwalpha = 1 / length
    WWMA = 0.0
    WWMA := wwalpha * src + (1 - wwalpha) * nz(WWMA[1])
    WWMA
WWMA = Wwma_Func(src, length)
Zlema_Func(src, length) =>
    zxLag = length / 2 == math.round(length / 2) ? length / 2 : (length - 1) / 2
    zxEMAData = src + src - src[zxLag]
    ZLEMA = ta.ema(zxEMAData, length)
    ZLEMA
ZLEMA = Zlema_Func(src, length)
Tsf_Func(src, length) =>
    lrc = ta.linreg(src, length, 0)
    lrc1 = ta.linreg(src, length, 1)
    lrs = lrc - lrc1
    TSF = ta.linreg(src, length, 0) + lrs
    TSF
TSF = Tsf_Func(src, length)
HMA = ta.wma(2 * ta.wma(src, length / 2) - ta.wma(src, length), math.round(math.sqrt(length)))
T3e1 = ta.ema(src, length)
T3e2 = ta.ema(T3e1, length)
T3e3 = ta.ema(T3e2, length)
T3e4 = ta.ema(T3e3, length)
T3e5 = ta.ema(T3e4, length)
T3e6 = ta.ema(T3e5, length)
T3c1 = -T3a1 * T3a1 * T3a1
T3c2 = 3 * T3a1 * T3a1 + 3 * T3a1 * T3a1 * T3a1
T3c3 = -6 * T3a1 * T3a1 - 3 * T3a1 - 3 * T3a1 * T3a1 * T3a1
T3c4 = 1 + 3 * T3a1 + T3a1 * T3a1 * T3a1 + 3 * T3a1 * T3a1
T3 = T3c1 * T3e6 + T3c2 * T3e5 + T3c3 * T3e4 + T3c4 * T3e3


getMA(src, length) =>
    ma = 0.0
    if mav == 'SMA'
        ma := ta.sma(src, length)
        ma

    if mav == 'EMA'
        ma := ta.ema(src, length)
        ma

    if mav == 'WMA'
        ma := ta.wma(src, length)
        ma

    if mav == 'DEMA'
        ma := DEMA
        ma

    if mav == 'TMA'
        ma := ta.sma(ta.sma(src, math.ceil(length / 2)), math.floor(length / 2) + 1)
        ma

    if mav == 'VAR'
        ma := VAR
        ma

    if mav == 'WWMA'
        ma := WWMA
        ma

    if mav == 'ZLEMA'
        ma := ZLEMA
        ma

    if mav == 'TSF'
        ma := TSF
        ma

    if mav == 'HULL'
        ma := HMA
        ma

    if mav == 'TILL'
        ma := T3
        ma
    ma

MA = getMA(src, length)


atr2 = ta.sma(ta.tr, Periods)
atr = changeATR ? ta.atr(Periods) : atr2
up = MA - Multiplier * atr
up1 = nz(up[1], up)
up := close[1] > up1 ? math.max(up, up1) : up
dn = MA + Multiplier * atr
dn1 = nz(dn[1], dn)
dn := close[1] < dn1 ? math.min(dn, dn1) : dn
trend = 1
trend := nz(trend[1], trend)
trend := trend == -1 and close > dn1 ? 1 : trend == 1 and close < up1 ? -1 : trend
upPlot = plot(trend == 1 ? up : na, title='Up Trend', color=color.new(color.green, 100), linewidth=0, style=plot.style_linebr)
buySignal = trend == 1 and trend[1] == -1
plotshape(buySignal ? up : na, title='UpTrend Begins', location=location.absolute, style=shape.circle, size=size.tiny, color=color.new(color.green, 100))
plotshape(buySignal and showsignals ? up : na, title='Buy', text='Buy', location=location.absolute, style=shape.labelup, size=size.tiny, color=color.new(color.green, 0), textcolor=color.new(color.white, 0))
dnPlot = plot(trend == 1 ? na : dn, title='Down Trend', style=plot.style_linebr, linewidth=0, color=color.new(color.red, 100))
sellSignal = trend == -1 and trend[1] == 1
plotshape(sellSignal ? dn : na, title='DownTrend Begins', location=location.absolute, style=shape.circle, size=size.tiny, color=color.new(color.red, 100))
plotshape(sellSignal and showsignals ? dn : na, title='Sell', text='Sell', location=location.absolute, style=shape.labeldown, size=size.tiny, color=color.new(color.red, 0), textcolor=color.new(color.white, 0))
mPlot = plot(ohlc4, title='', style=plot.style_circles, linewidth=0)
colorup = input.color(defval = color.new(color.green, 60), title = "ColorU", inline = 'color')
colordown = input.color(defval = color.new(color.red, 60), title = "ColorD", inline = 'color')
longFillColor = highlighting ? trend == 1 ? colorup : color.white : color.new(color.white, 100)
shortFillColor = highlighting ? trend == -1 ? colordown : color.white : color.new(color.white, 100)
fill(mPlot, upPlot, title='UpTrend Highligter', color=longFillColor)
fill(mPlot, dnPlot, title='DownTrend Highligter', color=shortFillColor)
alertcondition(buySignal, title='SuperTrend Buy', message='SuperTrend Buy!')
alertcondition(sellSignal, title='SuperTrend Sell', message='SuperTrend Sell!')
changeCond = trend != trend[1]
alertcondition(changeCond, title='SuperTrend Direction Change', message='SuperTrend has changed direction!')


if buySignal
    strategy.entry("Enter Long", strategy.long)
else if sellSignal
    strategy.entry("Enter Short", strategy.short)
- Tối đa hóa lợi nhuận PMax
- SuperJump quay lại Bollinger Band
- Super Scalper
- ESSMA
- Super Scalper - 5 phút 15 phút
- Chiến lược của OCC R5.1
- 2 Phát hiện hướng màu trung bình chuyển động
- Mẫu cảnh báo ML
- HALFTREND + HEMA + SMA (Chiến lược tín hiệu sai)
- Cảnh báo chéo trung bình chuyển động, nhiều khung thời gian (MTF)
- TradingView Alerts cho MT4 MT5 + biến động động
- Dòng ma trận
- Super Scalper - 5 phút 15 phút
- Chỉ số sức mạnh tương đối - Sự khác biệt - Libertus
- Phục hồi tuyến tính ++
- RedK Dual VADER với thanh năng lượng
- Khu vực hợp nhất - Sống
- Ước tính định lượng định chất
- Cảnh báo chéo trung bình chuyển động, nhiều khung thời gian (MTF)
- MACD Reloaded STRATEGY
- Giao dịch ABC
- 15MIN BTCUSDTPERP BOT
- Shannon Entropy V2
- SUPERTREND ATR WITH TRAILING STOP LOSS
- Dòng lưu lượng v3
- tương lai tiền điện tử scalping hàng giờ với ma & rsi - ogcheckers
- ATR được làm mịn
- Order Block Finder
- TrendScalp-FractalBox-3EMA
- Các tín hiệu QQE