RedK Dual VADER với thanh năng lượng
Tác giả:ChaoZhang, Ngày: 2022-05-24 11:49:07Tags:SMAEMAWMA
Những cải tiến trực quan mà tôi đã thêm vào VADER-DEB giúp mang lại nhiều hiểu biết hơn về hoạt động thị trường bằng cách
- phơi bày đồ thị VADER kép / dài theo mặc định (mà chúng tôi sử dụng như một đại diện cho tâm lý) - và nó hiển thị bây giờ như một khu vực (thay vì một biểu đồ) - Bạn vẫn có thể ẩn đồ thị tâm lý trong cài đặt chỉ số và
- bằng cách sử dụng các thanh năng lượng hướng (thay vì các đường năng lượng trong v3.0).
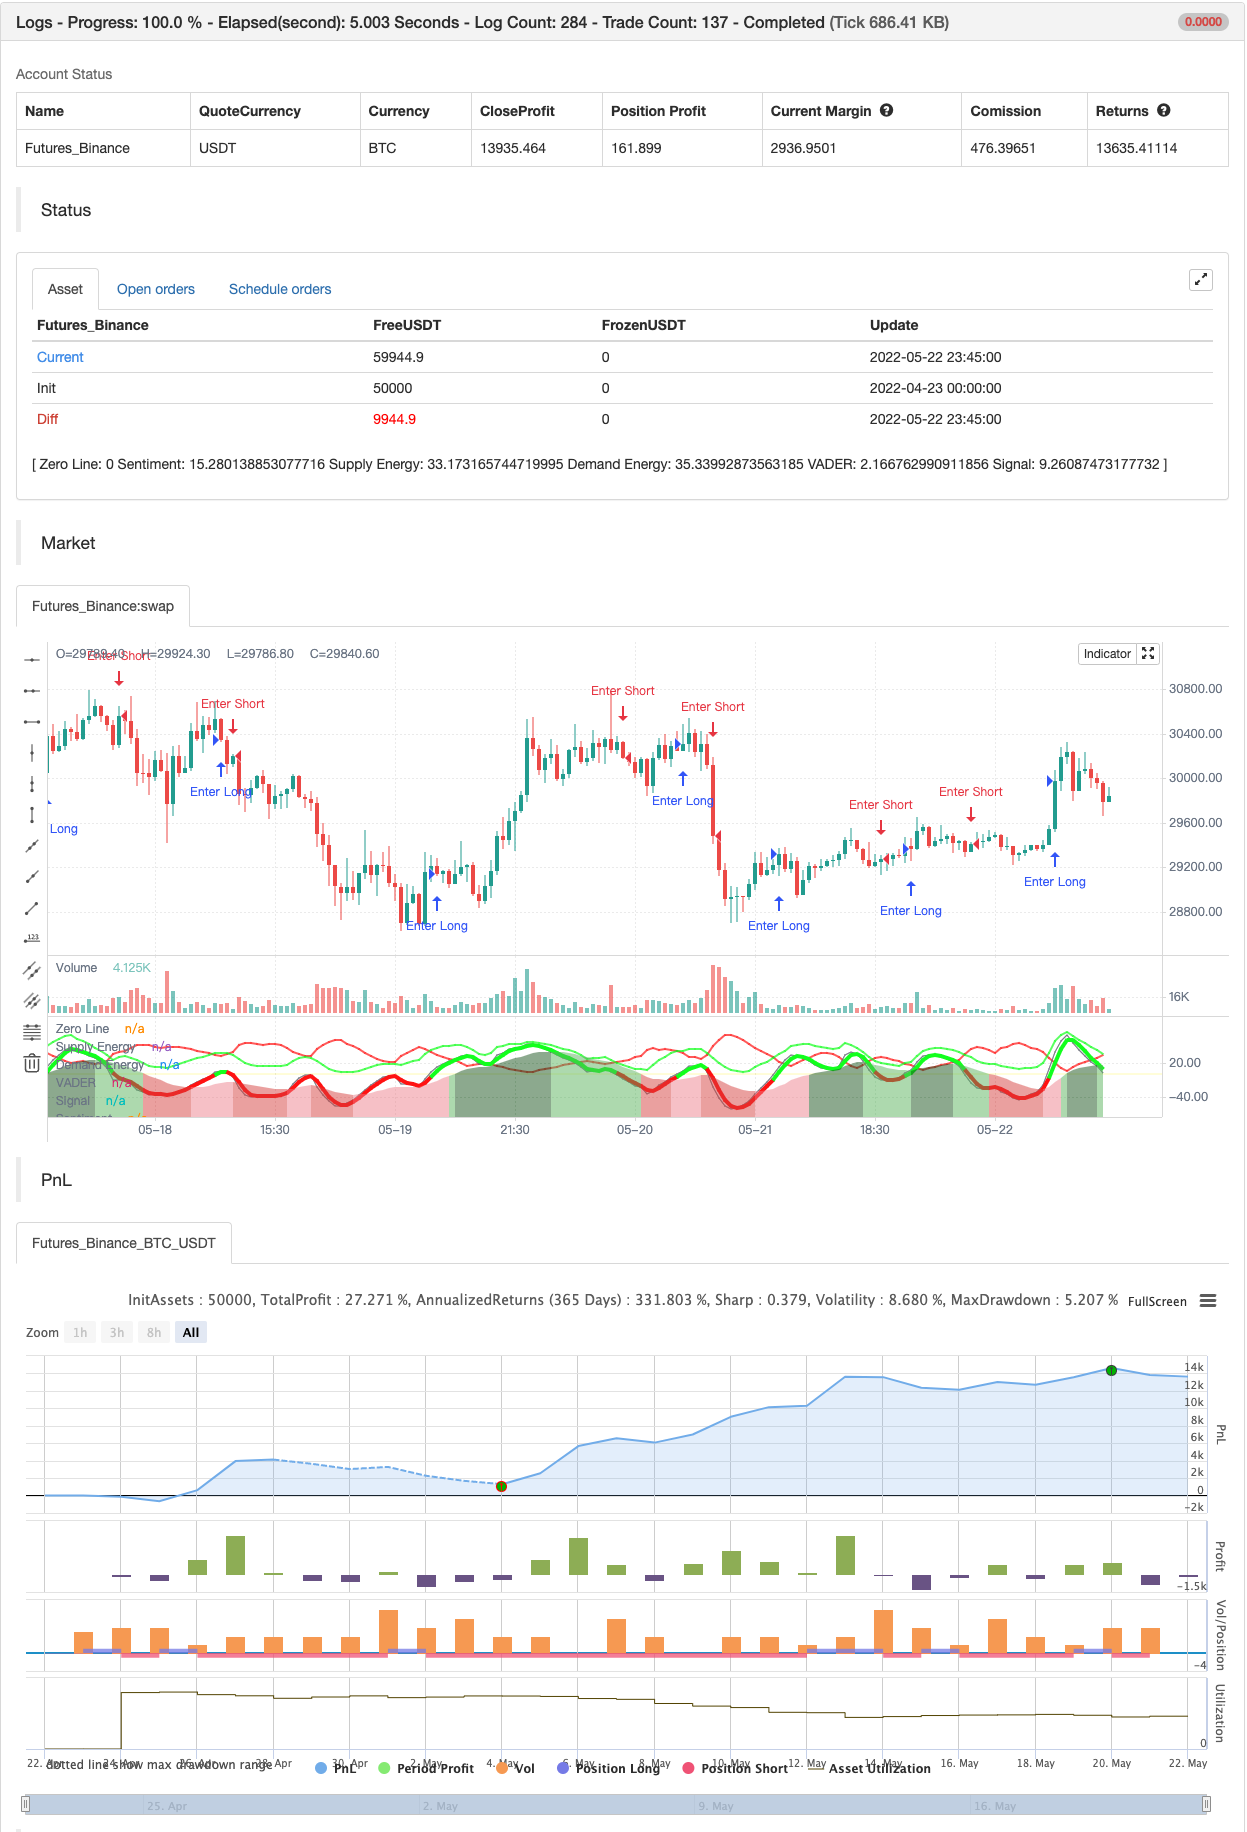
Vì vậy, đây là VADER kép với các thanh năng lượng
Những thay đổi này có thể được coi là nhỏ, nhưng theo quan điểm của tôi, tôi thấy chúng hấp dẫn hơn về mặt trực quan và tốt hơn cho hành động lái xe - Điều này hoạt động tốt hơn cho tôi như một người thị giác - vì vậy tôi nghĩ rằng sẽ chia sẻ với những người khác có thể giống như tôi... Đây là lý do tại sao tôi quyết định xuất bản nó như một phiên bản riêng biệt và không phải là một bản cập nhật cho chỉ số hiện có - để bạn có thể lựa chọn bạn thích sử dụng.
Không có sự thay đổi trong tính toán cốt lõi trong mã. Như thể hiện trong biểu đồ ở trên, nơi chúng tôi so sánh cả hai phiên bản VADER cạnh nhau.
Nếu bạn hài lòng với VADER v3.0, xin vui lòng tiếp tục sử dụng nó.
Chúc may mắn!
backtest
/*backtest
start: 2022-04-23 00:00:00
end: 2022-05-22 23:59:00
period: 45m
basePeriod: 5m
exchanges: [{"eid":"Futures_Binance","currency":"BTC_USDT"}]
*/

// This source code is subject to the terms of the Mozilla Public License 2.0 at https://mozilla.org/MPL/2.0/
// © RedKTrader

//@version=5
indicator('RedK Dual VADER with Energy Bars [VADER-DEB]', 'RedK VADER-DEB v4.0', precision=0, timeframe='', timeframe_gaps=false)

// This version is the same as VADER v3.0 with enhanced visuals, using Energy Bars instead of the positive/energy lines
// Sentiment plot changed from histogram to area and is exposed by default (hence Dual w/ Energy Bars -- DEB)
// No change in core calculations from VADER v3.0  -- and that's why i'll just call it VADER v4.0

// ***********************************************************************************************************
// Choose volume calculation method.. Relative vs full.
// Relative magnifies effect of recent volume spikes (up or down)
f_RelVol(_value, _length) =>
    min_value = ta.lowest(_value, _length)
    max_value = ta.highest(_value, _length)
    ta.stoch(_value, max_value, min_value, _length) / 100
// ***********************************************************************************************************

// ***********************************************************************************************************
// Choose MA type for the base DER calculation ..
// WMA is my preference and is default .. SMA is really slow and lags a lot - but added for comparison
f_derma(_data, _len, MAOption) =>
    value =
      MAOption == 'SMA' ? ta.sma(_data, _len) :
      MAOption == 'EMA' ? ta.ema(_data, _len) :
      ta.wma(_data, _len)
// ***********************************************************************************************************


// ===========================================================================================================
//      Inputs
// ===========================================================================================================

price   = close
length  = input.int(10, minval=1)
DER_avg = input.int(5, 'Average', minval=1, inline='DER', group='Directional Energy Ratio')
MA_Type = input.string('WMA', 'DER MA type', options=['WMA', 'EMA', 'SMA'], inline='DER', group='Directional Energy Ratio')
smooth  = input.int(3, 'Smooth', minval=1,  inline='DER_1', group='Directional Energy Ratio')

show_senti = input.bool(true, 'Sentiment',  inline='DER_s', group='Directional Energy Ratio')
senti   = input.int(20, 'Length', minval=1, inline='DER_s', group='Directional Energy Ratio')


v_calc  = input.string('Relative', 'Calculation', options=['Relative', 'Full', 'None'], group='Volume Parameters')
vlookbk = input.int(20, 'Lookback (for Relative)', minval=1,                            group='Volume Parameters')

// ===========================================================================================================
//          Calculations
// ===========================================================================================================

// Volume Calculation Option  -- will revert to no volume acceleration for instruments with no volume data
vola    =
  v_calc == 'None' or na(volume) ? 1 :
  v_calc == 'Relative' ? f_RelVol(volume, vlookbk) :
  volume

R       = (ta.highest(2) - ta.lowest(2)) / 2                    // R is the 2-bar average bar range - this method accomodates bar gaps
sr      = ta.change(price) / R                                  // calc ratio of change to R
rsr     = math.max(math.min(sr, 1), -1)                         // ensure ratio is restricted to +1/-1 in case of big moves
c       = fixnan(rsr * vola)                                    // add volume accel -- fixnan adresses cases where no price change between bars

c_plus  = math.max(c, 0)                                        // calc directional vol-accel energy
c_minus = -math.min(c, 0)

// plot(c_plus)
// plot(c_minus)


avg_vola    = f_derma(vola, length, MA_Type)
dem         = f_derma(c_plus, length, MA_Type)  / avg_vola          // directional energy ratio
sup         = f_derma(c_minus, length, MA_Type) / avg_vola

adp         = 100 * ta.wma(dem, DER_avg)                            // average DER
asp         = 100 * ta.wma(sup, DER_avg)
anp         = adp - asp                                             // net DER..
anp_s       = ta.wma(anp, smooth)

// Calculate Sentiment - a VADER for a longer period and can act as a baseline (compared to a static 0 value)
// note we're not re-calculating vol_avg, demand or supply energy for sentiment. this would've been a different approach
s_adp       = 100 * ta.wma(dem, senti)                            // average DER for sentiment length
s_asp       = 100 * ta.wma(sup, senti)
V_senti     = ta.wma(s_adp - s_asp, smooth)


// ===========================================================================================================
//      Colors & plots
// ===========================================================================================================
c_adp   = color.new(#11ff20, 30)
c_asp   = color.new(#ff1111, 30)
c_fd    = color.new(color.green, 80)
c_fs    = color.new(color.red, 80)
c_zero  = color.new(#ffee00, 70)

c_up    = color.new(#11ff20, 0)
c_dn    = color.new(#ff1111, 0)

up      = anp_s >= 0
s_up    = V_senti >=0

hline(0, 'Zero Line', c_zero, hline.style_solid)

// =============================================================================
// v4.0 --- Sentiment will be represented as a 4-color area graph
c_grow_above = #1b5e2080
c_grow_below = #dc4c4a80
c_fall_above = #66bb6a80
c_fall_below = #ef8e9880

sflag_up = math.abs(V_senti) >= math.abs(V_senti[1])

plot(show_senti ? V_senti : na, "Sentiment", style=plot.style_area,
 color = s_up ? (sflag_up ? c_grow_above : c_fall_above) :
 sflag_up ? c_grow_below : c_fall_below)

// ===========================================================================================================
//      v4.0 Use Energy Bars instead of DER lines
// ===========================================================================================================

// Prep the Energy Bars
bo = asp
bc = adp
bh = math.max(bo, bc)
bl = math.min(bo, bc)

rising      = ta.change(bc) > 0

c_barup     = #11ff2088
c_bardn     = #ff111188
c_bardj     = #ffffff88

barcolor    = bc > bo and rising ? c_barup : bc < bo and not rising ? c_bardn : c_bardj
//plotcandle(bo, bh, bl, bc, 'Energy Bars', barcolor, barcolor, bordercolor = barcolor)

// ============================================================================================================

s = plot(asp, 'Supply Energy', c_asp, 2, display = display.none)
d = plot(adp, 'Demand Energy', c_adp, 2, display = display.none)

plot(anp, 'VADER', color.new(color.gray, 30), display=display.none)
plot(anp_s, 'Signal', up ? c_up : c_dn, 4)

// ===========================================================================================================
//      v2.0 adding alerts
// ===========================================================================================================

Alert_up    = ta.crossover(anp_s,0)
Alert_dn    = ta.crossunder(anp_s,0)
Alert_swing = ta.cross(anp_s,0)

// "." in alert title for the alerts to show in the right order up/down/swing
alertcondition(Alert_up,    ".   VADER Crossing 0 Up",      "VADER Up - Buying Energy Detected!")
alertcondition(Alert_dn,    "..  VADER Crossing 0 Down",    "VADER Down - Selling Energy Detected!")
alertcondition(Alert_swing, "... VADER Crossing 0",         "VADER Swing - Possible Reversal")

// ===========================================================================================================
//      v3.0 more alerts for VADER crossing Sentiment
// ===========================================================================================================

v_speedup = ta.crossover(anp_s, V_senti)
v_slowdn  = ta.crossunder(anp_s, V_senti)
alertcondition(v_speedup,   "*  VADER Speeding Up",      "VADER Speeding Up!")
alertcondition(v_slowdn,    "** VADER Slowing Down",    "VADER Slowing Down!")


if Alert_up
    strategy.entry("Enter Long", strategy.long)
else if Alert_dn
    strategy.entry("Enter Short", strategy.short)
- Chiến lược giao dịch định lượng dựa trên đường trung bình động và băng Bollinger
- Cảnh báo chéo trung bình chuyển động, nhiều khung thời gian (MTF)
- HALFTREND + HEMA + SMA (Chiến lược tín hiệu sai)
- Tỷ lệ năng lượng hướng tăng tốc theo khối lượng RedK
- Rainbow Oscillator
- RedK Momentum Bars
- ESSMA
- Super Scalper
- SuperJump quay lại Bollinger Band
- MACD thông minh hơn
- Chiến lược ngập + thoát tốt nhất
- Bollinger Awesome Alert R1
- Plugin đồng bộ đa sàn giao dịch
- Triangle Leverage (Lợi nhuận từ giá giao dịch của các đồng tiền nhỏ)
- bybit Reverse Contract Dynamic Grid (Mạng lưới đặc biệt)
- TradingView Alerts cho MT4 MT5 + biến động động
- Dòng ma trận
- Super Scalper - 5 phút 15 phút
- Chỉ số sức mạnh tương đối - Sự khác biệt - Libertus
- Phục hồi tuyến tính ++
- Khu vực hợp nhất - Sống
- Ước tính định lượng định chất
- Cảnh báo chéo trung bình chuyển động, nhiều khung thời gian (MTF)
- MACD Reloaded STRATEGY
- Đường trung bình di chuyển siêu xu hướng
- Giao dịch ABC
- 15MIN BTCUSDTPERP BOT
- Shannon Entropy V2
- SUPERTREND ATR WITH TRAILING STOP LOSS
- Dòng lưu lượng v3