Chiến lược ngập + thoát tốt nhất
Tác giả:ChaoZhang, Ngày: 2022-05-25 14:40:18Tags:RMAEMAWMA
Chào các thương nhân.
Đây là một thuật toán đơn giản cho một chiến lược Tradingview theo dõi sự hội tụ của 2 chỉ số không liên quan.
Sự hội tụ là giải pháp cho vấn đề giao dịch của tôi. Đó là một câu đố với khả năng vô hạn và chỉ có một vài sự kết hợp hiệu quả.
Đây là cái tôi thích.
- Mô hình ngập
- Giá so với Mức trung bình động để phát hiện sự đột phá
Định nghĩa
Hãy lấy sổ ghi chép và cà phê (tốt cho sự tập trung).
Mô hình ngập là mô hình đảo ngược hai nến.
Nến thứ hai hoàn toàn
Mô hình ngập tăng xuất hiện trong một xu hướng giảm và là một sự kết hợp của một nến màu đỏ theo sau là một nến màu xanh lá cây lớn hơn Mô hình Engulfing giảm xuất hiện trong xu hướng giảm và là sự kết hợp của một ngọn nến màu xanh lá cây theo sau là một ngọn nến màu đỏ lớn hơn
Ví dụ:https://imgur.com/a/krDDUz4
Chúng tôi chán rồi thưa ngài... mục đích của tất cả những điều này là gì?
Tóm lại, một sự ngập là một mô hình để theo dõi sự đảo ngược. (toàn bộ khán giả TradingView đứng lên và vỗ tay) Thêm các bộ lọc giá so với trung bình di chuyển cho phép theo dõi sự đảo ngược với động lực (nửa khán giả sụp đổ vì điều này quá tuyệt vời)
Được rồi, thưa ngài. Ông đã thu hút sự quan tâm của tôi.
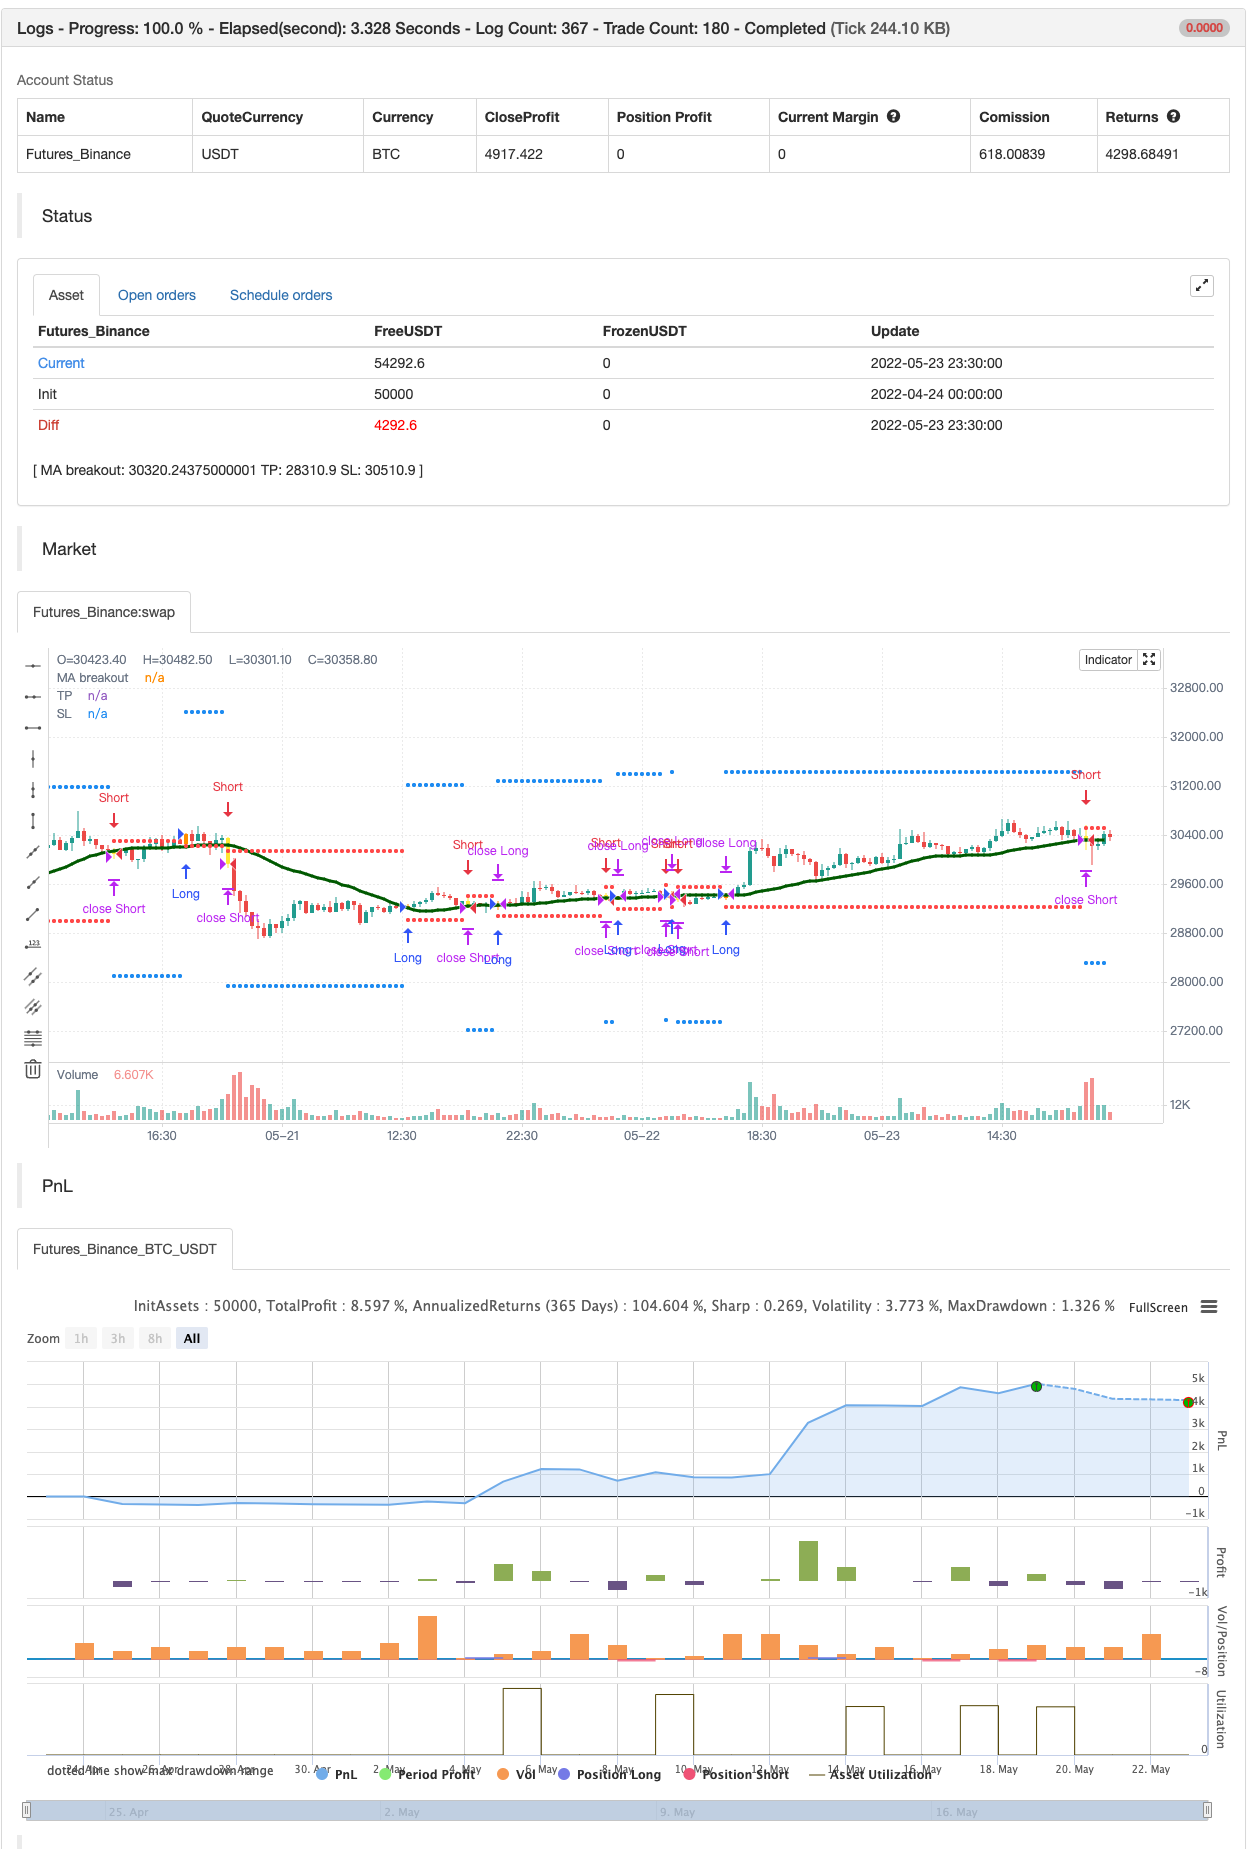
Tôi đã bao gồm một số bộ lọc backtest thú vị:
- lọc phạm vi ngày
- lợi nhuận linh hoạt theo giá trị USD (được vẽ màu xanh)
- Giá trị dừng lỗ linh hoạt trong USD (được vẽ màu đỏ)
Chúc may mắn. Dave.
backtest
/*backtest
start: 2022-04-24 00:00:00
end: 2022-05-23 23:59:00
period: 30m
basePeriod: 15m
exchanges: [{"eid":"Futures_Binance","currency":"BTC_USDT"}]
*/

//@version=4
//@author=Daveatt

StrategyName = "BEST Engulfing + MA"
ShortStrategyName = "BEST Engulfing + MA"

strategy(title=StrategyName, shorttitle=ShortStrategyName, overlay=true,
 pyramiding=2, default_qty_value=500, precision=7, currency=currency.USD,
 commission_value=0.2,commission_type=strategy.commission.percent, initial_capital=10000)

includeEngulfing = true

includeMA = true
source_ma = input(title="Source Price vs MA", type=input.source, defval=close)
typeofMA = input(title="Type of MA", defval="SMA", options=["RMA", "SMA", "EMA", "WMA", "VWMA", "SMMA", "KMA", "TMA", "HullMA", "DEMA", "TEMA"])
length_ma = input(32, title = "MA Length", type=input.integer)

// ---------- Candle components and states
GreenCandle = close > open
RedCandle = close < open
NoBody = close==open
Body = abs(close-open)


// bullish conditions
isBullishEngulfing1 = max(close[1],open[1]) < max(close,open) and min(close[1],open[1]) > min(close,open) and Body > Body[1] and GreenCandle and RedCandle[1]
isBullishEngulfing2 = max(close[1],open[1]) < max(close,open) and min(close[1],open[1]) <= min(close,open) and Body > Body[1] and GreenCandle and RedCandle[1]

// bearish conditions
isBearishEngulfing1 = max(close[1],open[1]) < max(close,open) and min(close[1],open[1]) > min(close,open) and Body > Body[1] and RedCandle and GreenCandle[1]
isBearishEngulfing2 = max(close[1],open[1]) >= max(close,open) and min(close[1],open[1]) > min(close,open) and Body > Body[1] and RedCandle and GreenCandle[1]

// consolidation of conditions
isBullishEngulfing = isBullishEngulfing1 or isBullishEngulfing2
isBearishEngulfing = isBearishEngulfing1 or isBearishEngulfing2

//isBullishEngulfing = max(close[1],open[1]) < max(close,open) and min(close[1],open[1]) > min(close,open) and Body > Body[1] and GreenCandle and RedCandle[1]
//isBearishEngulfing = max(close[1],open[1]) < max(close,open) and min(close[1],open[1]) > min(close,open) and Body > Body[1] and RedCandle and GreenCandle[1]

Engulf_curr = 0 - barssince(isBearishEngulfing) + barssince(isBullishEngulfing)
Engulf_Buy = Engulf_curr < 0 ? 1 : 0
Engulf_Sell = Engulf_curr > 0 ? 1 : 0


// Price vs MM


smma(src, len) =>
    smma = 0.0
    smma := na(smma[1]) ? sma(src, len) : (smma[1] * (len - 1) + src) / len
    smma

ma(smoothing, src, length) =>
    if smoothing == "RMA"
        rma(src, length)
    else
        if smoothing == "SMA"
            sma(src, length)
        else
            if smoothing == "EMA"
                ema(src, length)
            else
                if smoothing == "WMA"
                    wma(src, length)
				else
					if smoothing == "VWMA"
						vwma(src, length)
					else
						if smoothing == "SMMA"
						    smma(src, length)
						else
							if smoothing == "HullMA"
								wma(2 * wma(src, length / 2) - wma(src, length), round(sqrt(length)))
							else
								if smoothing == "LSMA"
									src
								else
								    if smoothing == "KMA"
								        xPrice = src
                                        xvnoise = abs(xPrice - xPrice[1])
                                        nfastend = 0.666
                                        nslowend = 0.0645
                                        nsignal = abs(xPrice - xPrice[length])
                                        nnoise = sum(xvnoise, length)
                                        nefratio = iff(nnoise != 0, nsignal / nnoise, 0)
                                        nsmooth = pow(nefratio * (nfastend - nslowend) + nslowend, 2)
                                        nAMA = 0.0
                                        nAMA := nz(nAMA[1]) + nsmooth * (xPrice - nz(nAMA[1]))
                                        nAMA
								    else
								        if smoothing == "TMA"
									        sma(sma(close, length), length)
						                else
							                if smoothing == "DEMA"
							                    2 * src - ema(src, length)
							                else
							                    if smoothing == "TEMA"
							                        3 * (src - ema(src, length)) + ema(ema(src, length), length)
							                    else
		    							            src


MA = ma(typeofMA, source_ma, length_ma)

plot(MA, color=#006400FF, title="MA breakout", linewidth=3)

macrossover  = crossover (source_ma, MA)
macrossunder = crossunder(source_ma, MA)

since_ma_buy = barssince(macrossover)
since_ma_sell = barssince(macrossunder)
macross_curr = 0 - since_ma_sell + since_ma_buy
bullish_MA_cond = macross_curr < 0 ?  1 : 0
bearish_MA_cond = macross_curr > 0 ? 1  : 0

posUp = (Engulf_Buy ? 1 : 0) + (bullish_MA_cond ? 1 : 0)
posDn = (Engulf_Sell ? 1 : 0) + (bearish_MA_cond ? 1 : 0)

conditionUP = posUp == 2 and posUp[1] < 2
conditionDN = posDn == 2 and posDn[1] < 2


sinceUP = barssince(conditionUP)
sinceDN = barssince(conditionDN)

// primary-first signal of the trend
nUP = crossunder(sinceUP,sinceDN)
nDN = crossover(sinceUP,sinceDN)


// and the following secondary signals

// save of the primary signal
sinceNUP = barssince(nUP)
sinceNDN = barssince(nDN)

buy_trend   = sinceNDN > sinceNUP
sell_trend  = sinceNDN < sinceNUP

// engulfing by
barcolor(nUP ? color.orange : na, title="Bullish condition")
barcolor(nDN ? color.yellow : na, title="Bearish condition")

isLong  = nUP
isShort = nDN

long_entry_price    = valuewhen(nUP, close, 0)
short_entry_price   = valuewhen(nDN, close, 0)

longClose   = close[1] < MA
shortClose  = close[1] > MA

///////////////////////////////////////////////
//* Backtesting Period Selector | Component *//
///////////////////////////////////////////////


StartYear = input(2017, "Backtest Start Year",minval=1980)
StartMonth = input(1, "Backtest Start Month",minval=1,maxval=12)
StartDay = input(1, "Backtest Start Day",minval=1,maxval=31)
testPeriodStart = timestamp(StartYear,StartMonth,StartDay,0,0)

StopYear = input(2020, "Backtest Stop Year",minval=1980)
StopMonth = input(12, "Backtest Stop Month",minval=1,maxval=12)
StopDay = input(31, "Backtest Stop Day",minval=1,maxval=31)
testPeriodStop = timestamp(StopYear,StopMonth,StopDay,0,0)

testPeriod() => true


//////////////////////////
//* Profit Component *//
//////////////////////////

input_tp_pips = input(2000, "Backtest Profit Goal (in USD)",minval=0)
input_sl_pips = input(200, "Backtest STOP Goal (in USD)",minval=0)


tp = buy_trend? long_entry_price + input_tp_pips : short_entry_price - input_tp_pips
sl = buy_trend? long_entry_price - input_sl_pips : short_entry_price + input_sl_pips


long_TP_exit  = buy_trend and high >= tp
short_TP_exit = sell_trend and low <= tp

plot(tp, title="TP", style=plot.style_circles, linewidth=3, color=color.blue)
plot(sl, title="SL", style=plot.style_circles, linewidth=3, color=color.red)

if testPeriod()
    strategy.entry("Long", 1, when=isLong)
    strategy.close("Long", when=longClose )
    strategy.exit("XL","Long", limit=tp,  when=buy_trend, stop=sl)


if testPeriod()
    strategy.entry("Short", 0,  when=isShort)
    strategy.close("Short", when=shortClose )
    strategy.exit("XS","Short", when=sell_trend, limit=tp, stop=sl)
- Rainbow Oscillator
- Super Scalper
- SuperJump quay lại Bollinger Band
- ESSMA
- MACD thông minh hơn
- Super Scalper - 5 phút 15 phút
- Scalping EMA ADX RSI với Buy/Sell
- ZigZag dựa trên động lượng
- VWMA-ADX Momentum và Chiến lược dài Bitcoin dựa trên xu hướng
- Williams %R - Đơn giản hóa
- Tiêu chí tối đa và tối thiểu dựa trên pivot
- Nick Rypock Lái ngược (NRTR)
- ZigZag PA Chiến lược V4.1
- Mua/Bán trong ngày
- Phân đoạn bị phá vỡ: giấc mơ bị phá vỡ của ai đó là lợi nhuận của bạn!
- Tối đa hóa lợi nhuận PMax
- Chiến lược chiến thắng hoàn hảo
- Stochastic + RSI, Chiến lược đôi
- Chiến lược Swing Hull/rsi/EMA
- Scalping Swing Trading Tool R1-4
- Bollinger Awesome Alert R1
- Plugin đồng bộ đa sàn giao dịch
- Triangle Leverage (Lợi nhuận từ giá giao dịch của các đồng tiền nhỏ)
- bybit Reverse Contract Dynamic Grid (Mạng lưới đặc biệt)
- TradingView Alerts cho MT4 MT5 + biến động động
- Dòng ma trận
- Super Scalper - 5 phút 15 phút
- Chỉ số sức mạnh tương đối - Sự khác biệt - Libertus
- Phục hồi tuyến tính ++
- RedK Dual VADER với thanh năng lượng