Chiến lược đường trung tâm dừng lỗ ATR năng động

Tác giả:ChaoZhang, Ngày: 2023-10-16 16:20:06
Tags:

img

Tổng quan

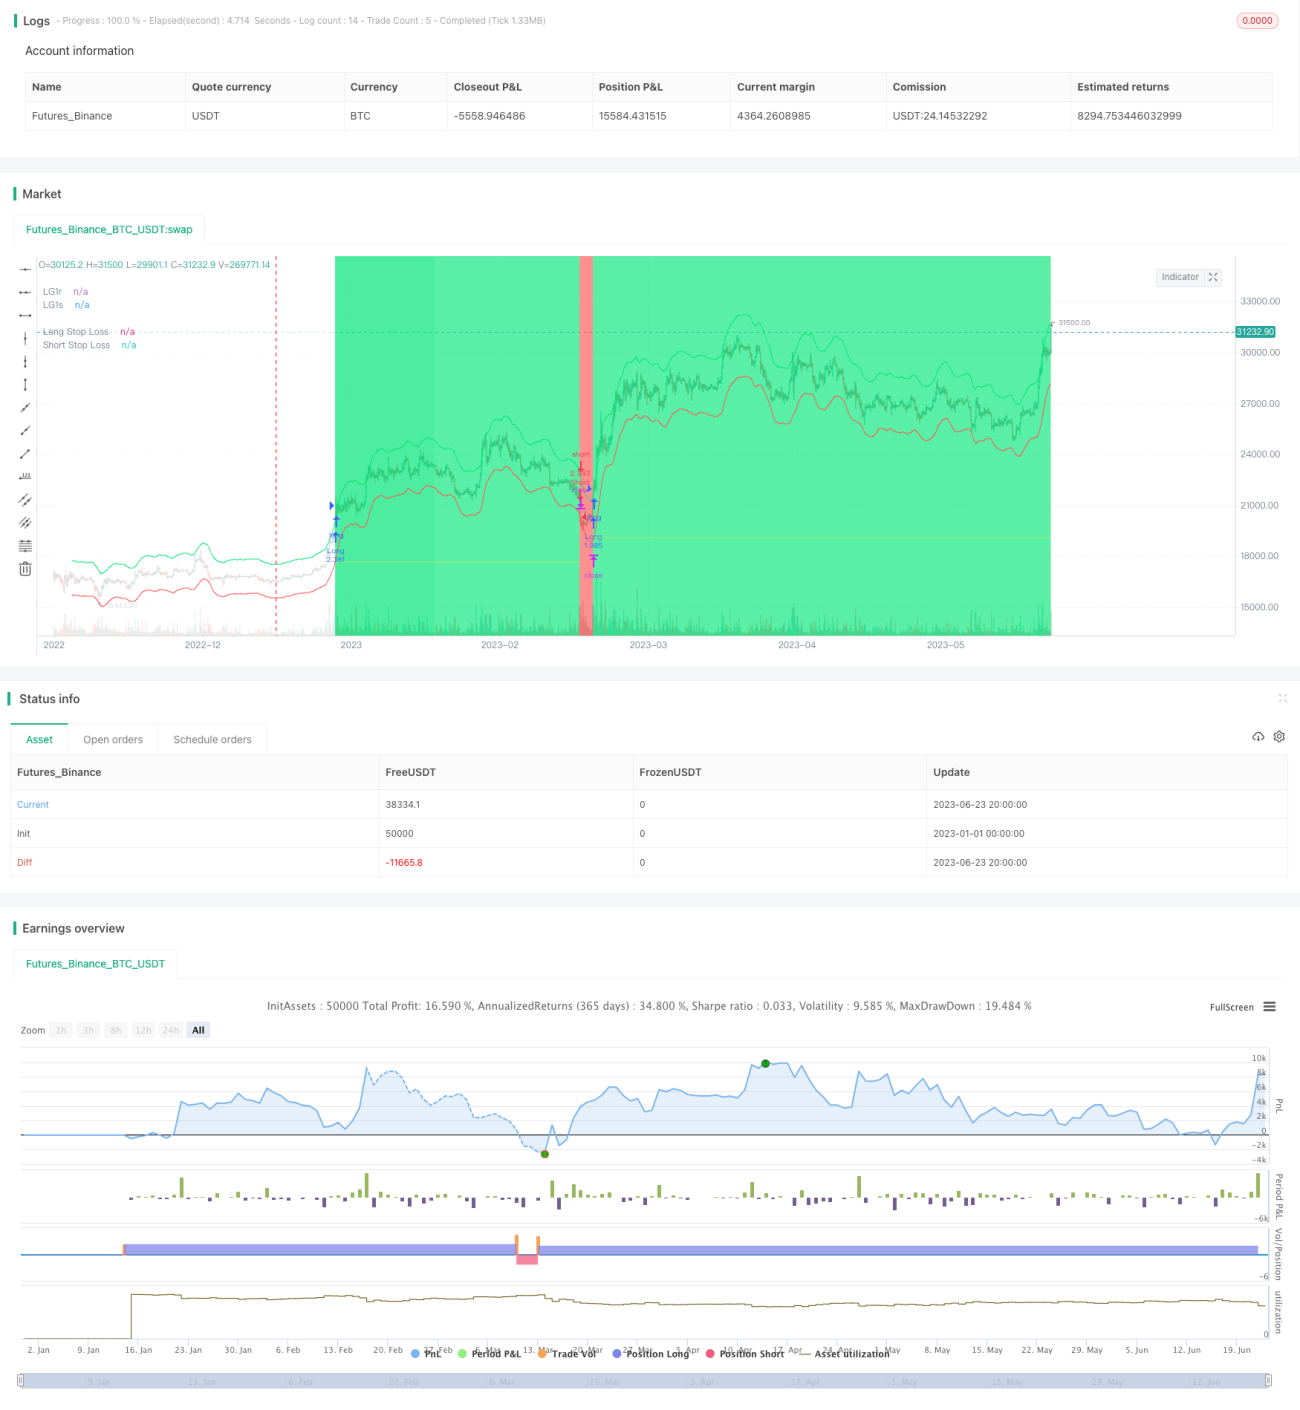
Chiến lược này sử dụng hàm hồi quy tuyến tính và phương pháp vuông nhỏ nhất để tính toán kênh giá, bao gồm hai đường màu xanh lá cây và đỏ.

Chiến lược logic

Chiến lược tính toán đường trung xLG bằng cách sử dụng hồi quy tuyến tính với chiều dài 25 và chuyển động 5. Sau đó nó lấy 6% trên và dưới đường trung như phạm vi kênh, với xLG1r là đường trên và xLG1s là đường dưới.

Khi giá trên xLG1r, nó đi dài. Khi giá dưới xLG1s, nó đi ngắn. Nó ghi lại thời gian dài và ngắn cuối cùng. Một tín hiệu dài được tạo khi thời gian dài cuối cùng lớn hơn thời gian ngắn cuối cùng. Một tín hiệu ngắn được tạo khi thời gian ngắn cuối cùng lớn hơn thời gian dài cuối cùng.

Các giao dịch động ATR dừng lỗ sử dụng thời gian ATR là 1 và nhân số 2. Đối với các giao dịch dài, dừng lỗ là giá đóng trừ ATR giá trị lần nhân số. Đối với các giao dịch ngắn, dừng lỗ là giá đóng cộng với ATR giá trị lần nhân số.

Phân tích lợi thế

  • Sử dụng kênh hồi quy tuyến tính để theo dõi xu hướng dài hạn
  • Đặt lỗ dừng dựa trên ATR điều chỉnh năng động để tránh dừng quá rộng hoặc quá chật
  • Các tín hiệu đột phá giá giúp tránh các tín hiệu sai

Rủi ro và cải tiến

  • Các thông số kênh hồi quy cần tối ưu hóa, phạm vi hiện tại có thể quá hẹp
  • ATR nhân cũng cần thử nghiệm để tìm các thông số tối ưu
  • Xem xét thêm xác nhận trên breakout để tránh breakouts sai

Hướng dẫn tối ưu hóa

  • Kiểm tra các khoảng thời gian hồi quy khác nhau để tìm các thông số tốt hơn
  • Thử các khoảng thời gian ATR khác nhau và stop loss multiplier
  • Thêm xác nhận bổ sung về tín hiệu đột phá, chẳng hạn như đột phá âm lượng

Kết luận

Chiến lược này kết hợp nhiều kỹ thuật như theo xu hướng, dừng động và tín hiệu đột phá để tạo ra một hệ thống theo dõi xu hướng thích nghi.


/*backtest
start: 2023-01-01 00:00:00
end: 2023-06-24 00:00:00
period: 4h
basePeriod: 15m
exchanges: [{"eid":"Futures_Binance","currency":"BTC_USDT"}]
*/

//@version=4
// Thanks to HPotter for the original code for Center of Gravity Backtest
strategy("Center of Gravity BF 🚀", overlay=true, initial_capital=10000, default_qty_type=strategy.percent_of_equity, default_qty_value=100, commission_type=strategy.commission.percent, commission_value=0.15)

/////////////// Time Frame ///////////////
testStartYear = input(2017, "Backtest Start Year") 
testStartMonth = input(1, "Backtest Start Month")
testStartDay = input(1, "Backtest Start Day")
testPeriodStart = timestamp(testStartYear,testStartMonth,testStartDay, 0, 0)

testStopYear = input(2019, "Backtest Stop Year")
testStopMonth = input(12, "Backtest Stop Month")
testStopDay = input(31, "Backtest Stop Day")
testPeriodStop = timestamp(testStopYear,testStopMonth,testStopDay, 0, 0)

testPeriod() => true

///////////// Center of Gravity /////////////
Length = input(25, minval=1)
m = input(5, minval=0)
Percent = input(6, minval=0, title="COG %")

xLG = linreg(close, Length, m)
xLG1r = xLG + ((close * Percent) / 100)
xLG1s = xLG - ((close * Percent) / 100)

pos = 0.0
pos := iff(close > xLG1r, 1, iff(close < xLG1s, -1, nz(pos[1], 0))) 
possig = iff(pos == 1, 1, iff(pos == -1, -1, pos))

/////////////// Srategy ///////////////
long = possig == 1 
short = possig == -1 

last_long = 0.0
last_short = 0.0
last_long := long ? time : nz(last_long[1])
last_short := short ? time : nz(last_short[1])

long_signal = crossover(last_long, last_short)
short_signal = crossover(last_short, last_long)

last_open_long_signal = 0.0
last_open_short_signal = 0.0
last_open_long_signal := long_signal ? open : nz(last_open_long_signal[1])
last_open_short_signal := short_signal ? open : nz(last_open_short_signal[1])

last_long_signal = 0.0
last_short_signal = 0.0
last_long_signal := long_signal ? time : nz(last_long_signal[1])
last_short_signal := short_signal ? time : nz(last_short_signal[1])

in_long_signal = last_long_signal > last_short_signal
in_short_signal = last_short_signal > last_long_signal

last_high = 0.0
last_low = 0.0
last_high := not in_long_signal ? na : in_long_signal and (na(last_high[1]) or high > nz(last_high[1])) ? high : nz(last_high[1])
last_low := not in_short_signal ? na : in_short_signal and (na(last_low[1]) or low < nz(last_low[1])) ? low : nz(last_low[1])

since_longEntry = barssince(last_open_long_signal != last_open_long_signal[1]) 
since_shortEntry = barssince(last_open_short_signal != last_open_short_signal[1]) 

/////////////// Dynamic ATR Stop Losses ///////////////
atrLkb = input(1, minval=1, title='ATR Stop Period')
atrMult = input(2, step=0.25, title='ATR Stop Multiplier') 
atr1 = atr(atrLkb)

longStop = 0.0
longStop :=  short_signal ? na : long_signal ? close - (atr1 * atrMult) : longStop[1]
shortStop = 0.0
shortStop := long_signal ? na : short_signal ? close + (atr1 * atrMult) : shortStop[1]

/////////////// Execution ///////////////
if testPeriod()
    strategy.entry("Long",  strategy.long, when=long)
    strategy.entry("Short", strategy.short, when=short)
    strategy.exit("Long SL", "Long", stop=longStop, when=since_longEntry > 0)
    strategy.exit("Short SL", "Short", stop=shortStop, when=since_shortEntry > 0)

/////////////// Plotting ///////////////
plot(xLG1r, color=color.lime, title="LG1r")
plot(xLG1s, color=color.red, title="LG1s")
plot(strategy.position_size <= 0 ? na : longStop, title="Long Stop Loss", color=color.yellow, style=plot.style_circles, linewidth=1)
plot(strategy.position_size >= 0 ? na : shortStop, title="Short Stop Loss", color=color.orange, style=plot.style_circles, linewidth=1)
bgcolor(strategy.position_size > 0 ? color.lime : strategy.position_size < 0 ? color.red : color.white, transp=90)
bgcolor(long_signal ? color.lime : short_signal ? color.red : na, transp=60)

Thêm nữa