Chiến lược chỉ số đảo ngược động lượng

Tổng quan
Chiến lược chỉ số động lực tương đối (RMI) là một chiến lược cải tiến dựa trên chỉ số động lực. Chiến lược này đánh giá xem thị trường có đang mua quá mức hay bán quá mức để nắm bắt cơ hội đảo ngược bằng cách tính toán động lực của sự thay đổi giá trong một khoảng thời gian.
Nguyên tắc chiến lược
Công thức tính toán của chiến lược RMI như sau:
javascript
xMom = xPrice - xPrice[Length] //计算Length周期内的价格变动
xMU = 如果xMom >= 0:之前xMU减去xMU/Length加上xMom;否则:之前xMU
xMD = 如果xMom <= 0:之前xMD减去xMD/Length加上xMom的绝对值;否则:0
RM = xMU / xMD
RMI = 100 * (RM / (1 + RM))
Chiến lược này đầu tiên tính toán biến động giá trong chu kỳ Length xMom. Nếu xMom> = 0, giá tăng, xMU tích lũy xMom; Nếu xMom < 0, giá giảm, xMD tích lũy xMom.
Khi RMI cao hơn giá trị thâm hụt của SellZone, nó có nghĩa là mua quá mức, bán tháo; khi RMI thấp hơn giá trị thâm hụt của BuyZone, nó có nghĩa là bán quá mức, mua nhiều hơn.
Lợi thế chiến lược
- Chỉ số RMI nhạy cảm hơn so với chỉ số RSI, có thể nắm bắt cơ hội biến động giá sớm hơn.
- RMI đo lường cường độ của đợt giảm giá và không bị ảnh hưởng bởi các cơn động đất.
- RMI dựa trên động lực, có thể đánh giá chính xác hơn tình trạng quá mua quá bán.
Rủi ro chiến lược
- Giống như các chiến lược đảo ngược khác, chiến lược RMI có nguy cơ bị mạo hiểm.
- Các tham số RMI cần được tối ưu hóa cho các giống khác nhau, nếu không có thể không hiệu quả.
- Cần thiết lập một ngưỡng mua và bán hợp lý, nếu không sẽ tạo ra quá nhiều tín hiệu giả.
Có thể giảm rủi ro bằng cách nới lỏng điểm dừng, tối ưu hóa các tham số và kết hợp với các chiến lược xu hướng.
Tối ưu hóa chiến lược
Chiến lược RMI có thể được tối ưu hóa theo các khía cạnh sau:
- Tối ưu hóa tham số Length, chọn độ dài chu kỳ tối đa hóa lợi nhuận của chiến lược.
- Tối ưu hóa ngưỡng mua bán quá mức, giảm khả năng tín hiệu sai.
- Tăng các cơ chế ngăn chặn tổn thất, kiểm soát tổn thất đơn lẻ.
- Kết hợp với theo dõi xu hướng hoặc chiến lược đồng nhất, tăng tỷ lệ chiến thắng.
- Lựa chọn thời gian giao dịch phù hợp với các đặc điểm của các giống khác nhau để tăng sự ổn định của chiến lược.
Tóm tắt
Chiến lược RMI có thể nắm bắt cơ hội điều chỉnh đường ngắn hiệu quả bằng cách đo biến động giá, thực hiện các hoạt động đảo ngược. Chiến lược RMI nhạy cảm hơn và không bị ảnh hưởng bởi các biến động so với chiến lược RSI. Tuy nhiên, chiến lược này vẫn có nguy cơ bị hoán đổi, cần tối ưu hóa các tham số và sử dụng chiến lược theo xu hướng để có hiệu quả tối đa.
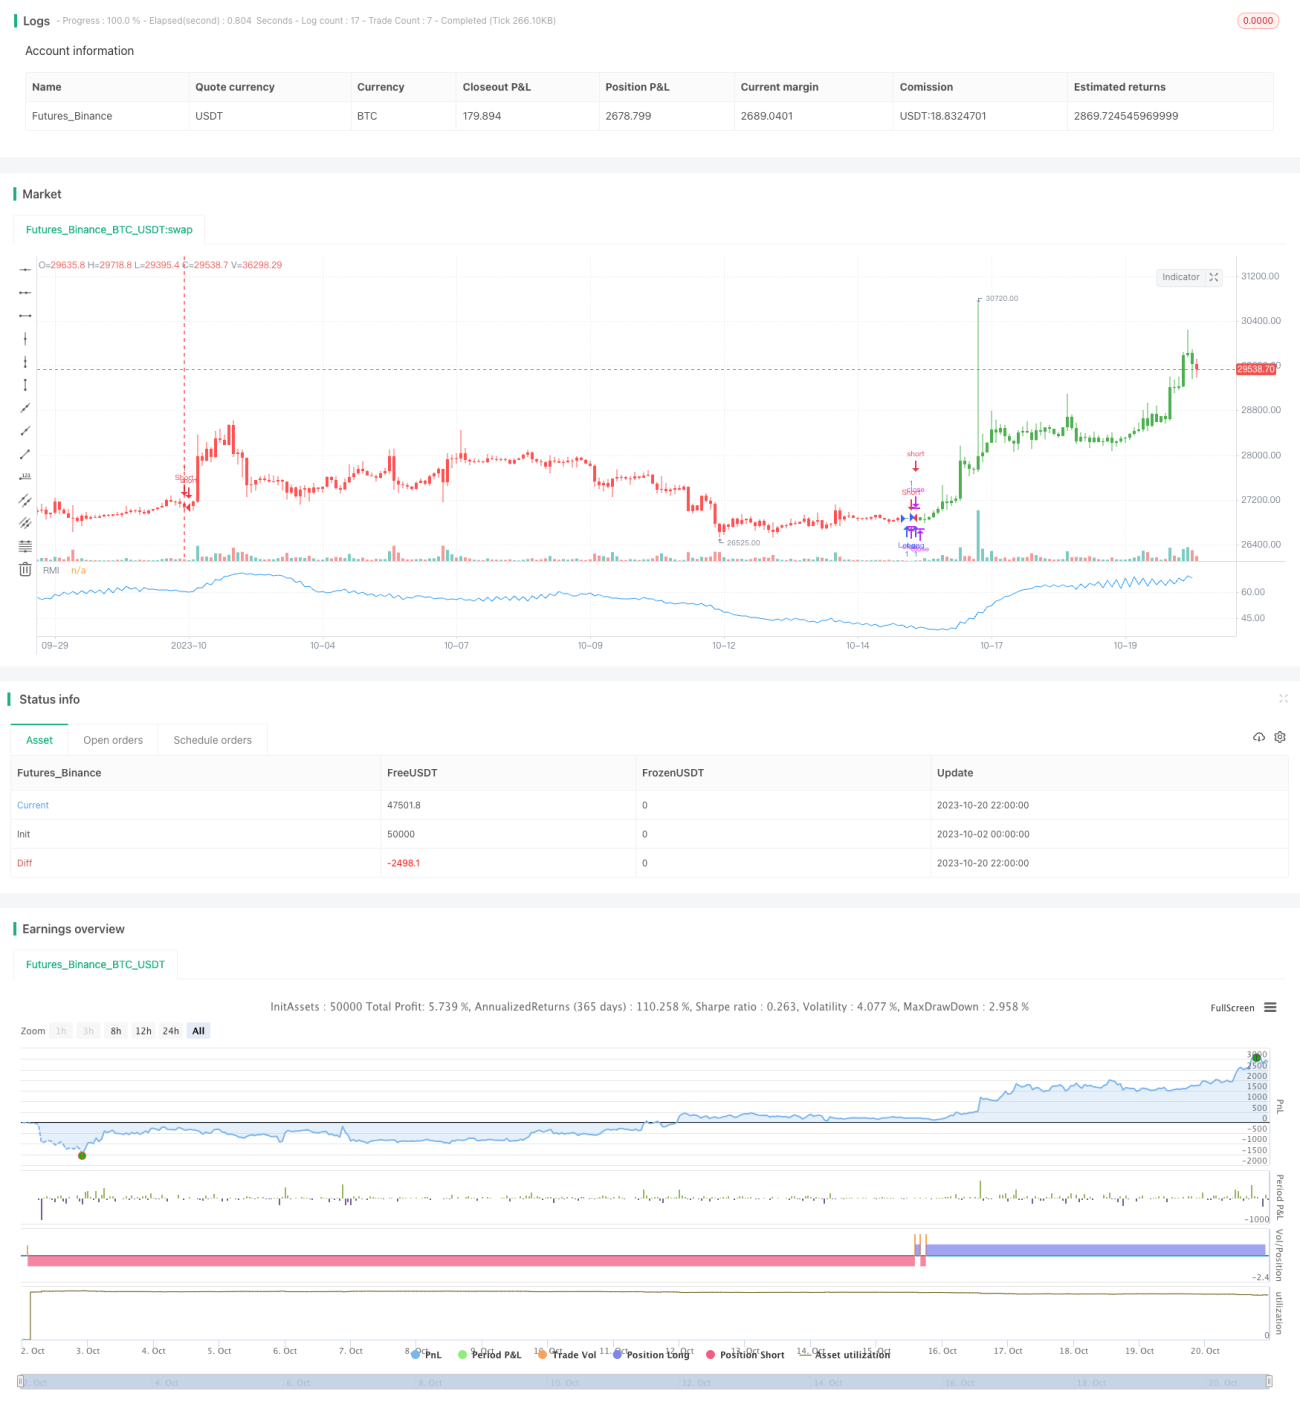
/*backtest
start: 2023-10-02 00:00:00
end: 2023-10-21 00:00:00
period: 2h
basePeriod: 15m
exchanges: [{"eid":"Futures_Binance","currency":"BTC_USDT"}]
*/

//@version=2
////////////////////////////////////////////////////////////
//  Copyright by HPotter v1.0 19/10/2017
// The Relative Momentum Index (RMI) was developed by Roger Altman. Impressed - 1