Chiến lược giao dịch đường trung bình động hàm mũ ba và đường trung bình động hàm mũ ngẫu nhiên
Tổng quan
Chiến lược này là một chiến lược theo dõi xu hướng, kết hợp các chỉ số trung bình di chuyển ba chỉ số và các chỉ số trung bình di chuyển trơn trần để tạo ra tín hiệu giao dịch. Khi các chỉ số di chuyển nhanh trên đường trung bình di chuyển, trung bình di chuyển trên đường trung bình di chuyển chậm hơn; khi các chỉ số di chuyển nhanh dưới đường trung bình di chuyển nhanh hơn, trung bình di chuyển dưới đường trung bình di chuyển chậm hơn.
Nguyên tắc
Sử dụng trung bình di chuyển chỉ số ba ngày 8, 14 và 50 ngày. Khi trung bình di chuyển chỉ số 14 ngày đi qua trung bình di chuyển chỉ số 14 ngày đi qua trung bình di chuyển chỉ số 50 ngày tạo ra tín hiệu xem nhiều; ngược lại, tín hiệu xem không.
Sử dụng chỉ số di chuyển trung bình trơn bằng chỉ số ngẫu nhiên ((Stochastic RSI) làm chỉ số phán đoán hỗ trợ. Cụ thể là: Đầu tiên tính RSI 14 ngày, sau đó tính chỉ số Stochastic dựa trên chỉ số RSI, cuối cùng tính chỉ số Stochastic 3 ngày trung bình di chuyển đơn giản để có được đường K và đường D. Khi đường K đi qua đường D, làm tín hiệu hỗ trợ xem nhiều hơn.
Khi tạo ra tín hiệu giao dịch, nếu giá cao hơn đường trung bình di chuyển chỉ số ngày 8, thì nhập thêm; nếu giá thấp hơn đường trung bình di chuyển chỉ số ngày 8, thì nhập bằng cách bỏ trống.
Địa điểm dừng là dưới/trên 1 lần ATR. Địa điểm dừng là trên/dưới 4 lần ATR.
Ưu điểm
Trung bình di chuyển như một chỉ số cơ bản, có thể theo dõi xu hướng thị trường một cách hiệu quả. Bằng cách kết hợp sử dụng nhiều chu kỳ, trung bình di chuyển ba chỉ số có thể đảm bảo sự nhạy cảm với xu hướng ngắn hạn và trung hạn.
Thêm Stochastic RSI như một chỉ số phán đoán phụ trợ, có thể lọc các tín hiệu giả và cải thiện độ chính xác của nhập cảnh.
Cài đặt vị trí dừng lỗ theo ATR, có thể theo dõi động mức độ biến động của thị trường, tránh dừng lỗ quá lớn hoặc quá nhỏ.
Các tham số của chiến lược này được thiết lập hợp lý, hoạt động tốt trong xu hướng lớn. Sự rút lui nhỏ, thu nhập ổn định, phù hợp cho hoạt động đường dài.
Rủi ro
Chiến lược kết hợp nhiều chỉ số làm tăng nguy cơ đảo ngược. Có thể có lỗi tín hiệu giao dịch khi đường trung bình di chuyển và Stochastic RSI phát ra tín hiệu ngược lại.
Các thiết lập dừng lỗ và dừng lại là bảo thủ hơn, có thể sẽ bị phá vỡ khi thị trường biến động mạnh và bị dừng lại, bỏ lỡ cơ hội xu hướng. Tại thời điểm này, bạn có thể điều chỉnh tham số ATR thích hợp hoặc tăng gấp nhiều lần dừng lỗ.
Do sử dụng trung bình di chuyển ba lần, khi đường nhanh và đường trung tốc đảo ngược, sẽ có một số độ trễ. Tại thời điểm này, cần chú ý đến việc liệu giá có tự đảo ngược để quyết định xem có nên tham gia hay không.
Chiến lược này chủ yếu phù hợp với các hoạt động theo xu hướng, hoạt động không tốt trong các tình huống cân bằng. Trong trường hợp này, bạn có thể xem xét tối ưu hóa các tham số chu kỳ của trung bình di chuyển hoặc sử dụng các chỉ số đánh giá khác.
Tối ưu hóa
Các chỉ số khác như MACD có thể được xem xét để tối ưu hóa thêm thời gian nhập học. Bạn cũng có thể thử nghiệm các kết hợp trung bình di chuyển của các tham số khác nhau.
Các tham số có thể được tối ưu hóa trong kiểm tra ATR nhiều không gian. Ví dụ, điều chỉnh dừng lỗ từ 1 ATR thành 1.5 ATR, dừng dừng từ 4 ATR thành 3 ATR để xem có thể có được lợi nhuận tốt hơn hay không.
Có thể thử nghiệm chỉ sử dụng moving average, loại bỏ chỉ số Stochastic RSI, để xem liệu có thể lọc ra nhiều tiếng ồn hơn để có được lợi nhuận ổn định hơn hay không.
Có thể xem xét thêm các điều kiện để đánh giá xu hướng, chẳng hạn như tăng chỉ số khối lượng giao dịch, đảm bảo hoạt động trong xu hướng cấp độ lớn.
Tóm tắt
Chiến lược này kết hợp sử dụng moving average ba chỉ số và chỉ số Stochastic RSI để xác định hướng của xu hướng. Các tín hiệu nhập cảnh nghiêm ngặt hơn, có thể giảm hiệu quả các giao dịch vô nghĩa. Cài đặt dừng dừng động theo dõi ATR, làm cho các tham số của chiến lược có khả năng tự điều chỉnh.
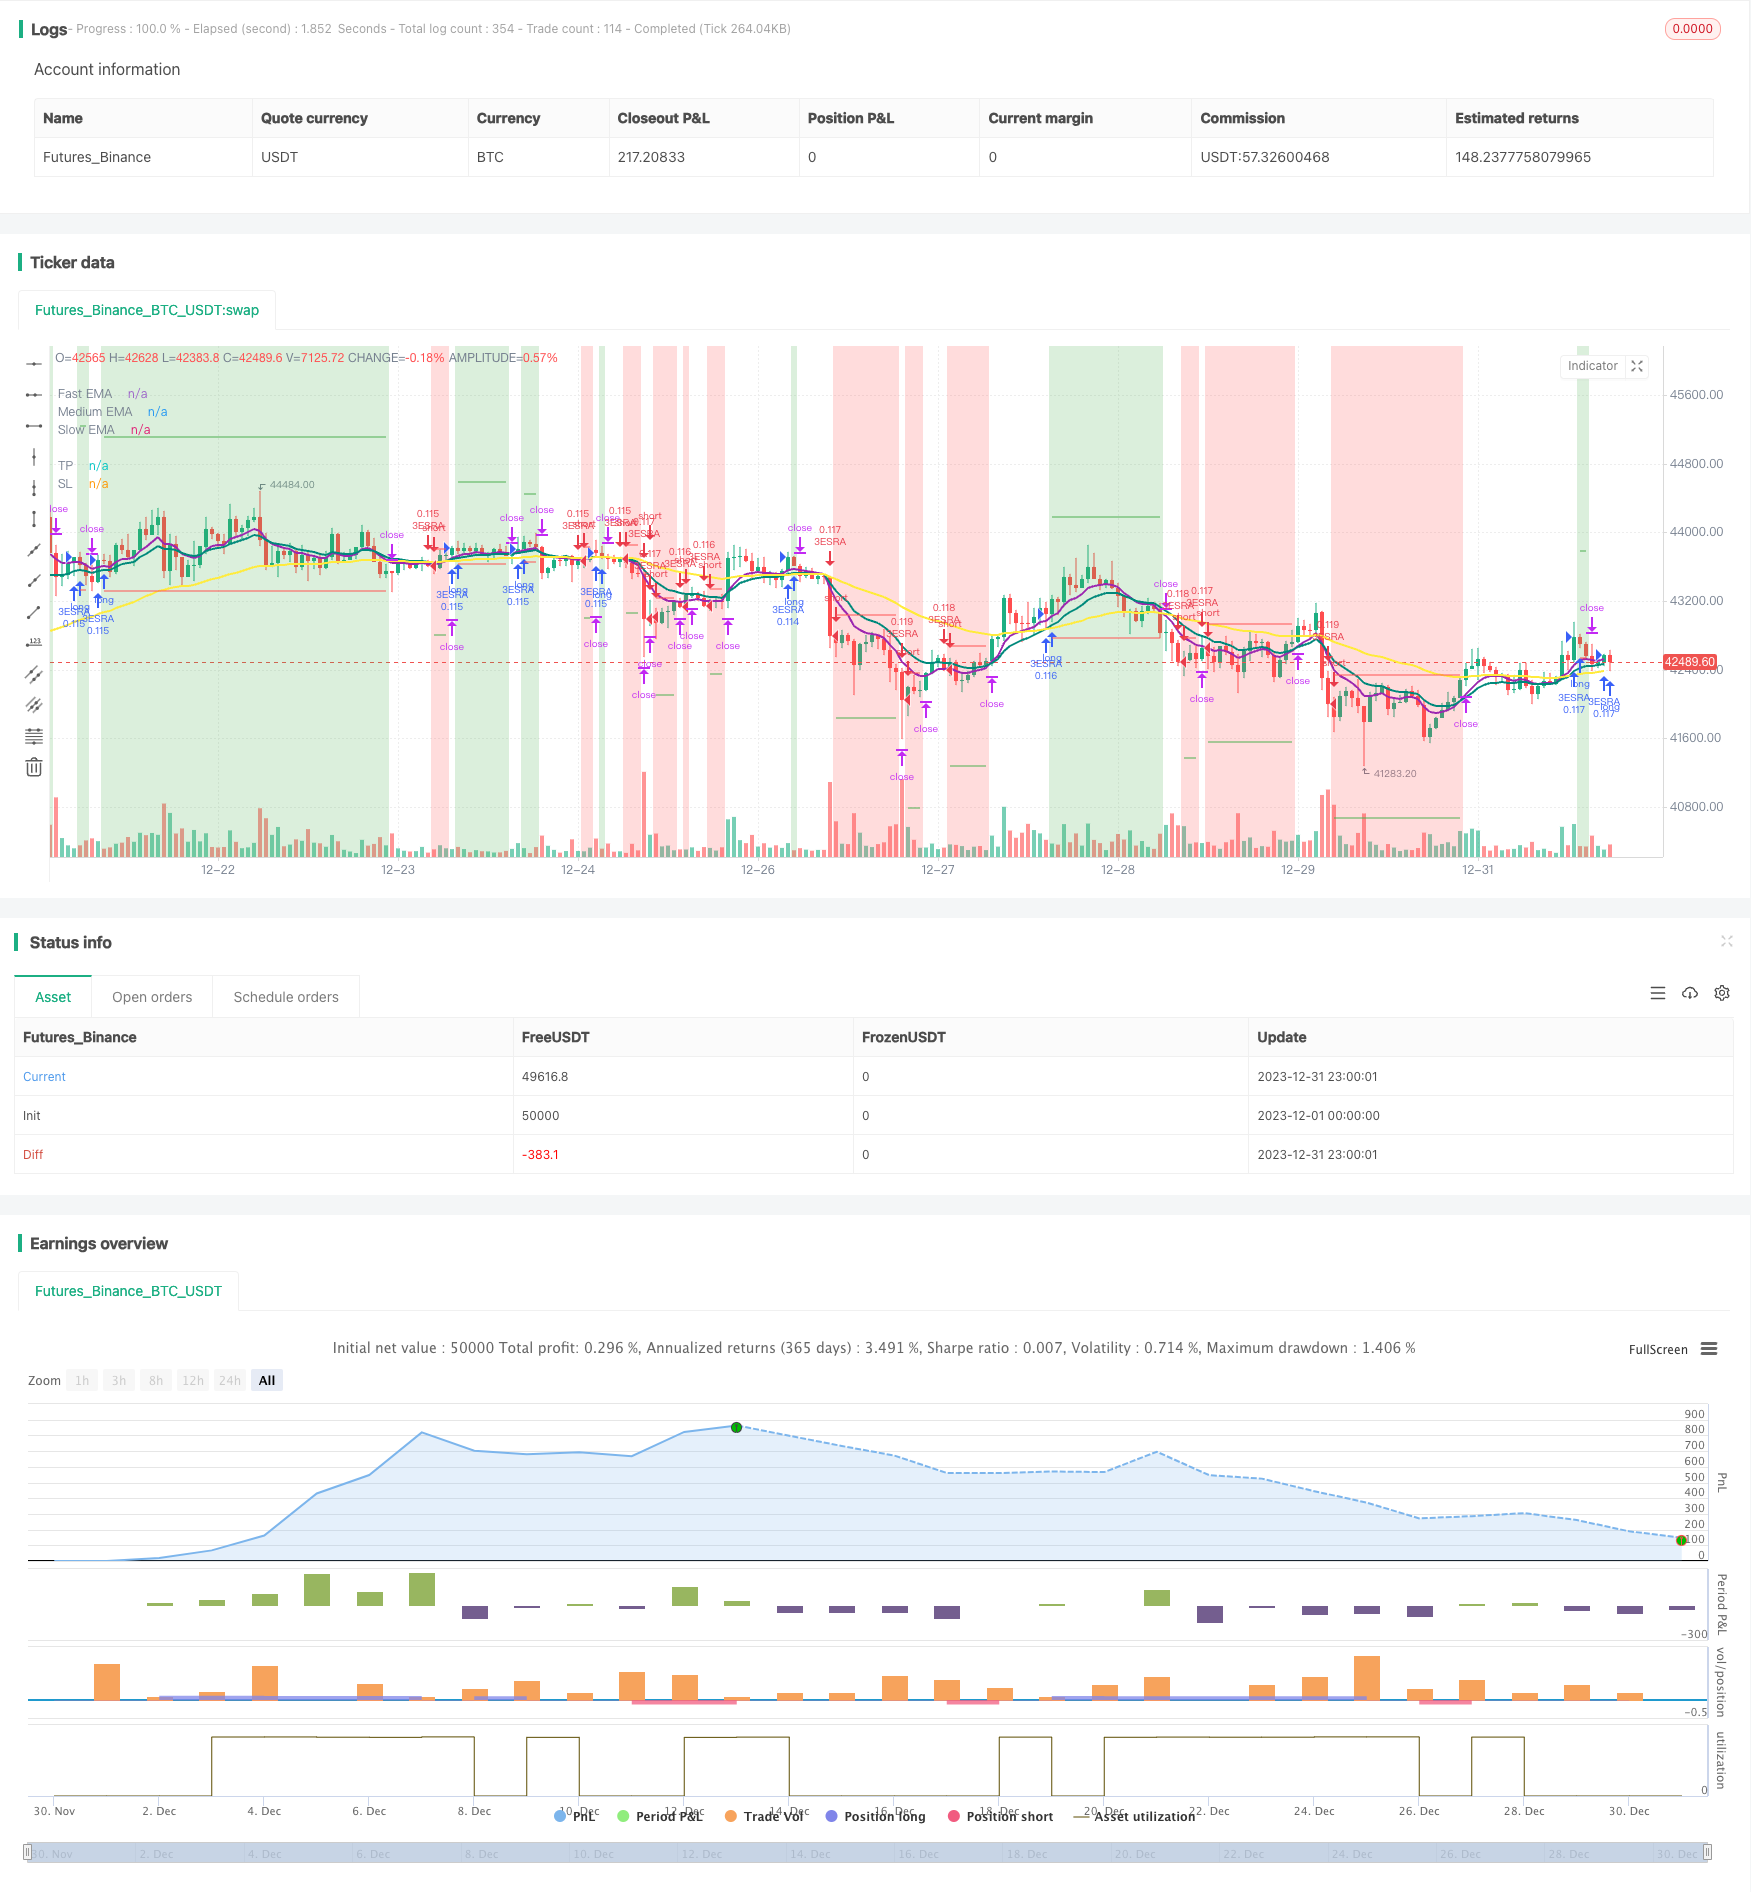
/*backtest
start: 2023-12-01 00:00:00
end: 2023-12-31 23:59:59
period: 1h
basePeriod: 15m
exchanges: [{"eid":"Futures_Binance","currency":"BTC_USDT"}]
*/

//              3ESRA
//              v0.2a

// Coded by Vaida Bogdan

// 3ESRA consists of a 3 EMA cross + a close above (for longs) the quickest EMA
// or below (for shorts). Note that I've deactivated the RSI Cross Over/Under
// (you can modify the code and activate it). The strategy also uses a stop loss
// that's at 1 ATR distance from the entry price and a take profit that's at
// 4 times the ATR distance from the entry price.

// Feedback:
// Tested BTCUSDT Daily
// 1. Stoch-RSI makes you miss opportunities.
// 2. Changing RR to 4:1 times ATR works better.

//@version=4
strategy(title="3 EMA + Stochastic RSI + ATR", shorttitle="3ESRA", overlay=true, pyramiding=1,
     process_orders_on_close=true, calc_on_every_tick=true,
     initial_capital=1000, currency = currency.USD, default_qty_value=10,
     default_qty_type=strategy.percent_of_equity,
     commission_type=strategy.commission.percent, commission_value=0.1, slippage=2)

startDate = input(title="Start Date", type=input.integer,
     defval=1, minval=1, maxval=31, group="Backtesting range")
startMonth = input(title="Start Month", type=input.integer,
     defval=1, minval=1, maxval=12, group="Backtesting range")
startYear = input(title="Start Year", type=input.integer,
     defval=1900, minval=1800, maxval=2100, group="Backtesting range")
endDate = input(title="End Date", type=input.integer,
     defval=1, minval=1, maxval=31, group="Backtesting range")
endMonth = input(title="End Month", type=input.integer,
     defval=1, minval=1, maxval=12, group="Backtesting range")
endYear = input(title="End Year", type=input.integer,
     defval=2040, minval=1800, maxval=2100, group="Backtesting range")

// Date range filtering
inDateRange = (time >= timestamp(syminfo.timezone, startYear, startMonth, startDate, 0, 0)) and
     (time < timestamp(syminfo.timezone, endYear, endMonth, endDate, 23, 59))

fast = input(8, minval=8, title="Fast EMA", group="EMAs")
medium = input(14, minval=8, title="Medium EMA", group="EMAs")
slow = input(50, minval=8, title="Slow EMA", group="EMAs")
src = input(close, title="Source")

smoothK = input(3, "K", minval=1, group="Stoch-RSI", inline="K&D")
smoothD = input(3, "D", minval=1, group="Stoch-RSI", inline="K&D")
lengthRSI = input(14, "RSI Length", minval=1, group="Stoch-RSI", inline="length")
lengthStoch = input(14, "Stochastic Length", minval=1, group="Stoch-RSI", inline="length")
rsiSrc = input(close, title="RSI Source", group="Stoch-RSI")

length = input(title="Length", defval=14, minval=1, group="ATR")
smoothing = input(title="Smoothing", defval="RMA", options=["RMA", "SMA", "EMA", "WMA"], group="ATR")

// EMAs
fastema = ema(src, fast)
mediumema = ema(src, medium)
slowema = ema(src, slow)

// S-RSI
rsi1 = rsi(rsiSrc, lengthRSI)
k = sma(stoch(rsi1, rsi1, rsi1, lengthStoch), smoothK)
d = sma(k, smoothD)
sRsiCrossOver = k[1] < d[1] and k > d
sRsiCrossUnder = k[1] > d[1] and k < d

// ATR
ma_function(source, length) =>
	if smoothing == "RMA"
		rma(source, length)
	else
		if smoothing == "SMA"
			sma(source, length)
		else
			if smoothing == "EMA"
				ema(source, length)
			else
				wma(source, length)
atr = ma_function(tr(true), length)

// Trading Logic
longCond1 = (fastema > mediumema) and (mediumema > slowema)
longCond2 = true
// longCond2 = sRsiCrossOver
longCond3 = close > fastema
longCond4 = strategy.position_size <= 0
longCond = longCond1 and longCond2 and longCond3 and longCond4 and inDateRange

shortCond1 = (fastema < mediumema) and (mediumema < slowema)
shortCond2 = true
// shortCond2 = sRsiCrossUnder
shortCond3 = close < fastema
shortCond4 = strategy.position_size >= 0
shortCond = shortCond1 and shortCond2 and shortCond3 and shortCond4 and inDateRange

var takeProfit = float(na), var stopLoss = float(na)
if longCond and strategy.position_size <= 0
    takeProfit := close + 4*atr
    stopLoss := close - 1*atr
    // takeProfit := close + 2*atr
    // stopLoss := close - 3*atr

else if shortCond and strategy.position_size >= 0
    takeProfit := close - 4*atr
    stopLoss := close + 1*atr
    // takeProfit := close - 2*atr
    // stopLoss := close + 3*atr

// Strategy calls
strategy.entry("3ESRA", strategy.long, comment="Long", when=longCond and strategy.position_size <= 0)
strategy.entry("3ESRA", strategy.short, comment="Short", when=shortCond and strategy.position_size >= 0)
strategy.exit(id="TP-SL", from_entry="3ESRA", limit=takeProfit, stop=stopLoss)
if (not inDateRange)
    strategy.close_all()

// Plot EMAs
plot(fastema, color=color.purple, linewidth=2, title="Fast EMA")
plot(mediumema, color=color.teal, linewidth=2, title="Medium EMA")
plot(slowema, color=color.yellow, linewidth=2, title="Slow EMA")
// Plot S-RSI
// plotshape((strategy.position_size > 0) ? na : sRsiCrossOver, title="StochRSI Cross Over", style=shape.triangleup, location=location.belowbar, color=color.teal, text="SRSI", size=size.small)
// Plot trade
bgcolor(strategy.position_size > 0 ? color.new(color.green, 75) : strategy.position_size < 0 ? color.new(color.red,75) : color(na))
// Plot Strategy
plot((strategy.position_size != 0) ? takeProfit : na, style=plot.style_linebr, color=color.green, title="TP")
plot((strategy.position_size != 0) ? stopLoss : na, style=plot.style_linebr, color=color.red, title="SL")