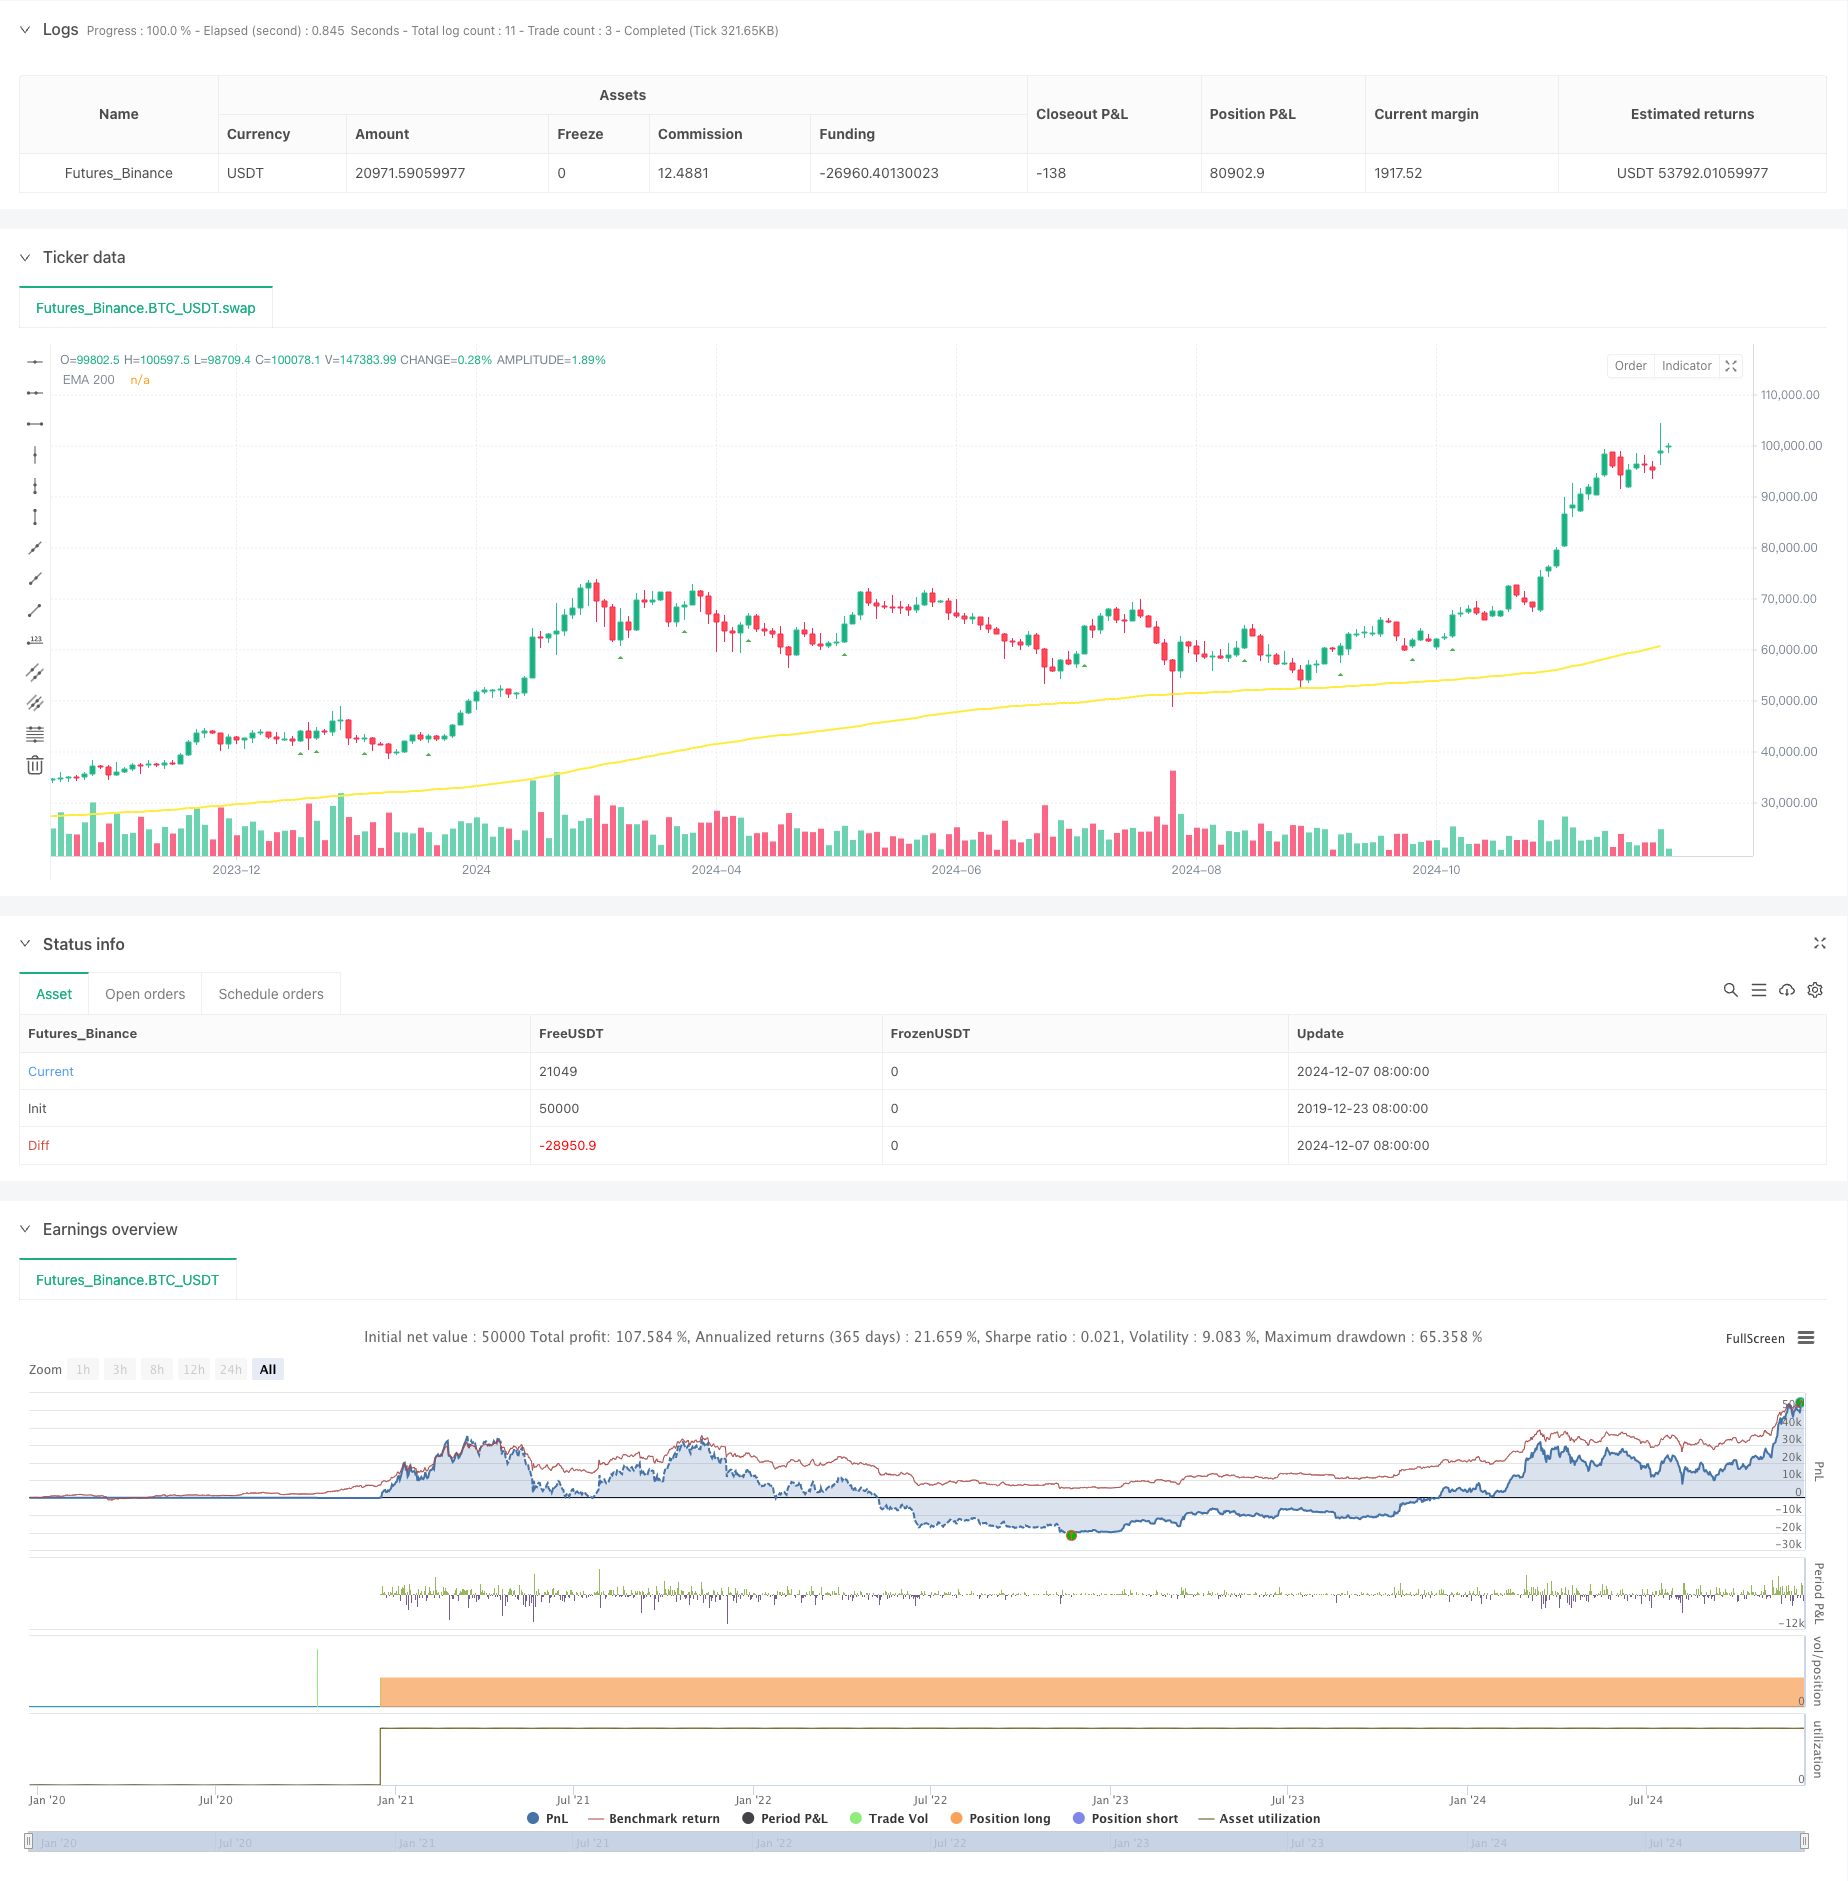
概述
该策略是一个基于指数移动平均线(EMA)和动量指标的趋势跟踪策略。它通过动量突破信号和EMA趋势过滤器相结合的方式,在市场趋势明确时进行交易。策略包含了完整的风险管理模块,灵活的交易时间过滤,以及详细的统计分析功能,以提升策略的稳定性和可靠性。
策略原理
策略的核心逻辑基于以下几个关键要素: 1. 动量信号识别:通过计算用户自定义时间周期内的动量值,当动量突破上行阈值时产生做多信号,突破下行阈值时产生做空信号。 2. EMA趋势过滤:使用200周期EMA作为趋势判断依据,价格在EMA之上允许做多,价格在EMA之下允许做空。 3. 时间过滤:可设置具体的交易时段,并支持GMT时区调整,使策略更好地适应不同市场的交易时间。 4. 风险控制:支持基于ATR或固定百分比的止损和止盈设置,并限制每日最大交易次数。
策略优势
- 趋势跟踪能力强:通过EMA和动量的双重确认,能够有效捕捉主要趋势行情。
- 风险管理完善:提供多种止损方案,既可以使用ATR动态止损,也可以使用固定百分比止损。
- 统计分析全面:实时跟踪多个性能指标,包括多空胜率、风险收益比等。
- 参数灵活可调:主要参数都可以根据不同市场特点进行优化调整。
策略风险
震荡市场风险:在横盘震荡市场可能产生频繁假突破信号。 建议解决方案:增加震荡指标过滤或加大突破阈值。
滑点风险:在波动剧烈时期可能面临较大滑点。 建议解决方案:设置合理的止损范围,避免在高波动时段交易。
过度交易风险:信号过于频繁可能导致过度交易。 建议解决方案:合理设置每日最大交易次数限制。
策略优化方向
- 动态参数优化:可以根据市场波动率自动调整动量阈值和EMA周期。
- 多时间周期分析:增加多个时间周期的趋势确认,提高信号可靠性。
- 市场环境识别:加入波动率分析模块,在不同市场环境下采用不同的参数设置。
- 信号强度分级:对突破信号进行强度分级,根据信号强度动态调整持仓规模。
总结
这是一个设计完善的趋势跟踪策略,通过动量突破和EMA趋势相结合的方式捕捉市场机会。策略的风险管理体系完整,统计分析功能强大,具有良好的实用性和可扩展性。通过持续优化和完善,该策略有望在不同市场环境下都能保持稳定的表现。
策略源码
/*backtest
start: 2019-12-23 08:00:00
end: 2024-12-09 08:00:00
period: 2d
basePeriod: 2d
exchanges: [{"eid":"Futures_Binance","currency":"BTC_USDT"}]
*/

//@version=6
strategy("[Mustang Algo] EMA Momentum Strategy",
         shorttitle="[Mustang Algo] Mom Strategy",
         overlay=true,
         initial_capital=10000,
         default_qty_type=strategy.fixed,
         default_qty_value=1,
         pyramiding=0,
         calc_on_every_tick=false,
         max_bars_back=5000)

// Momentum Parameters
len = input.int(10, minval=1, title="Length")
src = input(close, title="Source")
momTimeframe = input.timeframe("", title="Momentum Timeframe")
timeframe_gaps = input.bool(true, title="Autoriser les gaps de timeframe")
momFilterLong = input.float(5, title="Filtre Momentum Long", minval=0)
momFilterShort = input.float(-5, title="Filtre Momentum Short", maxval=0)

// EMA Filter
useEmaFilter = input.bool(true, title="Utiliser Filtre EMA")
emaLength = input.int(200, title="EMA Length", minval=1)

// Position Size
contractSize = input.float(1.0, title="Taille de position", minval=0.01, step=0.01)

// Time filter settings
use_time_filter = input.bool(false, title="Utiliser le Filtre de Temps")
start_hour = input.int(9, title="Heure de Début", minval=0, maxval=23)
start_minute = input.int(30, title="Minute de Début", minval=0, maxval=59)
end_hour = input.int(16, title="Heure de Fin", minval=0, maxval=23)
end_minute = input.int(30, title="Minute de Fin", minval=0, maxval=59)
gmt_offset = input.int(0, title="Décalage GMT", minval=-12, maxval=14)

// Risk Management
useAtrSl = input.bool(false, title="Utiliser ATR pour SL/TP")
atrPeriod = input.int(14, title="Période ATR", minval=1)
atrMultiplier = input.float(1.5, title="Multiplicateur ATR pour SL", minval=0.1, step=0.1)
stopLossPerc = input.float(1.0, title="Stop Loss (%)", minval=0.01, step=0.01)
tpRatio = input.float(2.0, title="Take Profit Ratio", minval=0.1, step=0.1)

// Daily trade limit
maxDailyTrades = input.int(2, title="Limite de trades par jour", minval=1)

// Variables for tracking daily trades
var int dailyTradeCount = 0

// Reset daily trade count
if dayofweek != dayofweek[1]
    dailyTradeCount := 0

// Time filter function
is_within_session() =>
    current_time = time(timeframe.period, "0000-0000:1234567", gmt_offset)
    start_time = timestamp(year, month, dayofmonth, start_hour, start_minute, 0)
    end_time = timestamp(year, month, dayofmonth, end_hour, end_minute, 0)
    in_session = current_time >= start_time and current_time <= end_time
    not use_time_filter or in_session

// EMA Calculation
ema200 = ta.ema(close, emaLength)

// Momentum Calculation
gapFillMode = timeframe_gaps ? barmerge.gaps_on : barmerge.gaps_off
mom = request.security(syminfo.tickerid, momTimeframe, src - src[len], gapFillMode)

// ATR Calculation
atr = ta.atr(atrPeriod)

// Signal Detection with Filters
crossoverUp = ta.crossover(mom, momFilterLong)
crossoverDown = ta.crossunder(mom, momFilterShort)

emaUpTrend = close > ema200
emaDownTrend = close < ema200

// Trading Conditions
longCondition = crossoverUp and (not useEmaFilter or emaUpTrend) and is_within_session() and dailyTradeCount < maxDailyTrades and barstate.isconfirmed
shortCondition = crossoverDown and (not useEmaFilter or emaDownTrend) and is_within_session() and dailyTradeCount < maxDailyTrades and barstate.isconfirmed

// Calcul des niveaux de Stop Loss et Take Profit
float stopLoss = useAtrSl ? (atr * atrMultiplier) : (close * stopLossPerc / 100)
float takeProfit = stopLoss * tpRatio

// Modification des variables pour éviter les erreurs de repainting
var float entryPrice = na
var float currentStopLoss = na
var float currentTakeProfit = na

// Exécution des ordres avec gestion des positions
if strategy.position_size == 0
    if longCondition
        entryPrice := close
        currentStopLoss := entryPrice - stopLoss
        currentTakeProfit := entryPrice + takeProfit
        strategy.entry("Long", strategy.long, qty=contractSize)
        strategy.exit("Exit Long", "Long", stop=currentStopLoss, limit=currentTakeProfit)
        dailyTradeCount += 1

    if shortCondition
        entryPrice := close
        currentStopLoss := entryPrice + stopLoss
        currentTakeProfit := entryPrice - takeProfit
        strategy.entry("Short", strategy.short, qty=contractSize)
        strategy.exit("Exit Short", "Short", stop=currentStopLoss, limit=currentTakeProfit)
        dailyTradeCount += 1

// Plot EMA
plot(ema200, color=color.yellow, linewidth=2, title="EMA 200")

// Plot Signals
plotshape(longCondition, title="Long Signal", location=location.belowbar, color=color.green, style=shape.triangleup, size=size.small)
plotshape(shortCondition, title="Short Signal", location=location.abovebar, color=color.red, style=shape.triangledown, size=size.small)

// // Performance Statistics
// var int longWins = 0
// var int longLosses = 0
// var int shortWins = 0
// var int shortLosses = 0

// if strategy.closedtrades > 0
//     trade = strategy.closedtrades - 1
//     isLong = strategy.closedtrades.entry_price(trade) < strategy.closedtrades.exit_price(trade)
//     isWin = strategy.closedtrades.profit(trade) > 0

//     if isLong and isWin
//         longWins += 1
//     else if isLong and not isWin
//         longLosses += 1
//     else if not isLong and isWin
//         shortWins += 1
//     else if not isLong and not isWin
//         shortLosses += 1

// longTrades = longWins + longLosses
// shortTrades = shortWins + shortLosses

// longWinRate = longTrades > 0 ? (longWins / longTrades) * 100 : 0
// shortWinRate = shortTrades > 0 ? (shortWins / shortTrades) * 100 : 0
// overallWinRate = strategy.closedtrades > 0 ? (strategy.wintrades / strategy.closedtrades) * 100 : 0

// avgRR = strategy.grossloss != 0 ? math.abs(strategy.grossprofit / strategy.grossloss) : 0

// // Display Statistics
// var table statsTable = table.new(position.top_right, 4, 7, border_width=1)
// if barstate.islastconfirmedhistory
//     table.cell(statsTable, 0, 0, "Type", bgcolor=color.new(color.blue, 90))
//     table.cell(statsTable, 1, 0, "Win", bgcolor=color.new(color.blue, 90))
//     table.cell(statsTable, 2, 0, "Lose", bgcolor=color.new(color.blue, 90))
//     table.cell(statsTable, 3, 0, "Daily Trades", bgcolor=color.new(color.blue, 90))
//     table.cell(statsTable, 0, 1, "Long", bgcolor=color.new(color.blue, 90))
//     table.cell(statsTable, 1, 1, str.tostring(longWins), bgcolor=color.new(color.blue, 90))
//     table.cell(statsTable, 2, 1, str.tostring(longLosses), bgcolor=color.new(color.blue, 90))
//     table.cell(statsTable, 3, 1, str.tostring(dailyTradeCount) + "/" + str.tostring(maxDailyTrades), bgcolor=color.new(color.blue, 90))
//     table.cell(statsTable, 0, 2, "Short", bgcolor=color.new(color.blue, 90))
//     table.cell(statsTable, 1, 2, str.tostring(shortWins), bgcolor=color.new(color.blue, 90))
//     table.cell(statsTable, 2, 2, str.tostring(shortLosses), bgcolor=color.new(color.blue, 90))
//     table.cell(statsTable, 0, 3, "Win Rate", bgcolor=color.new(color.blue, 90))
//     table.cell(statsTable, 1, 3, "Long: " + str.tostring(longWinRate, "#.##") + "%", bgcolor=color.new(color.blue, 90))
//     table.cell(statsTable, 2, 3, "Short: " + str.tostring(shortWinRate, "#.##") + "%", bgcolor=color.new(color.blue, 90))
//     table.cell(statsTable, 0, 4, "Overall", bgcolor=color.new(color.blue, 90))
//     table.cell(statsTable, 1, 4, "Win Rate: " + str.tostring(overallWinRate, "#.##") + "%", bgcolor=color.new(color.blue, 90))
//     table.cell(statsTable, 2, 4, "Total: " + str.tostring(strategy.closedtrades) + " | RR: " + str.tostring(avgRR, "#.##"), bgcolor=color.new(color.blue, 90))
//     table.cell(statsTable, 0, 5, "Trading Hours", bgcolor=color.new(color.blue, 90))
//     table.cell(statsTable, 1, 5, "Start: " + str.format("{0,time,HH:mm}", start_hour * 60 * 60 * 1000 + start_minute * 60 * 1000), bgcolor=color.new(color.blue, 90))
//     table.cell(statsTable, 2, 5, "End: " + str.format("{0,time,HH:mm}", end_hour * 60 * 60 * 1000 + end_minute * 60 * 1000), bgcolor=color.new(color.blue, 90))
//     table.cell(statsTable, 3, 5, "GMT: " + (gmt_offset >= 0 ? "+" : "") + str.tostring(gmt_offset), bgcolor=color.new(color.blue, 90))
//     table.cell(statsTable, 0, 6, "SL/TP Method", bgcolor=color.new(color.blue, 90))
//     table.cell(statsTable, 1, 6, useAtrSl ? "ATR-based" : "Percentage-based", bgcolor=color.new(color.blue, 90))
//     table.cell(statsTable, 2, 6, useAtrSl ? "ATR: " + str.tostring(atrPeriod) : "SL%: " + str.tostring(stopLossPerc), bgcolor=color.new(color.blue, 90))
//     table.cell(statsTable, 3, 6, "TP Ratio: " + str.tostring(tpRatio), bgcolor=color.new(color.blue, 90))
相关推荐