
Overview
This is a trend-following strategy based on multiple technical indicators and risk management. The strategy combines moving averages, Relative Strength Index (RSI), Directional Movement Index (DMI), and other technical indicators to identify market trends, while protecting capital through dynamic stop-loss, position management, and monthly maximum drawdown limits. The core concept lies in confirming trend validity through multi-dimensional technical indicators while strictly controlling risk exposure.
Strategy Principles
The strategy employs a multi-layered trend confirmation mechanism:
- Uses 8/21/50 period Exponential Moving Averages (EMA) to determine trend direction
- Utilizes price channel midline as a trend filter
- Incorporates RSI moving average (5-period) movement within 35-65 range to filter false breakouts
- Confirms trend strength through DMI indicator (14-period)
- Verifies trend continuation using momentum indicator (8-period) and volume expansion
- Implements ATR-based dynamic stop-loss for risk control
- Applies fixed-risk position sizing with 5% risk per trade of initial capital
- Sets 10% monthly maximum drawdown limit to prevent excessive losses
Strategy Advantages
- Multiple technical indicators cross-validation improves trend judgment accuracy
- Dynamic stop-loss mechanism effectively controls single trade risk
- Fixed-risk position sizing enables more rational capital utilization
- Monthly maximum drawdown limit provides systemic risk protection
- Volume indicator integration enhances trend confirmation reliability
- 2:1 reward-to-risk ratio improves long-term profitability
Strategy Risks
- Multiple indicators may lead to signal lag
- May generate frequent false signals in ranging markets
- Fixed-risk approach may lack flexibility during dramatic volatility changes
- Monthly drawdown limit might cause missing important trading opportunities
- May experience significant drawdowns during trend reversals
Strategy Optimization Directions
- Introduce adaptive indicator parameters to suit different market environments
- Develop more flexible position sizing schemes considering volatility changes
- Add quantitative trend strength assessment to optimize entry timing
- Design smarter monthly risk limit mechanisms
- Include market environment recognition module to adjust strategy parameters under different market conditions
Summary
The strategy establishes a relatively complete trend-following trading system through the comprehensive use of multi-dimensional technical indicators. Its strength lies in the comprehensive risk management framework, including dynamic stop-loss, position sizing, and drawdown control. While there are certain lag risks, the strategy has the potential to maintain stable performance across different market environments through optimization and improvement. The key is to enhance its adaptability to market environments while maintaining the core strategy logic.
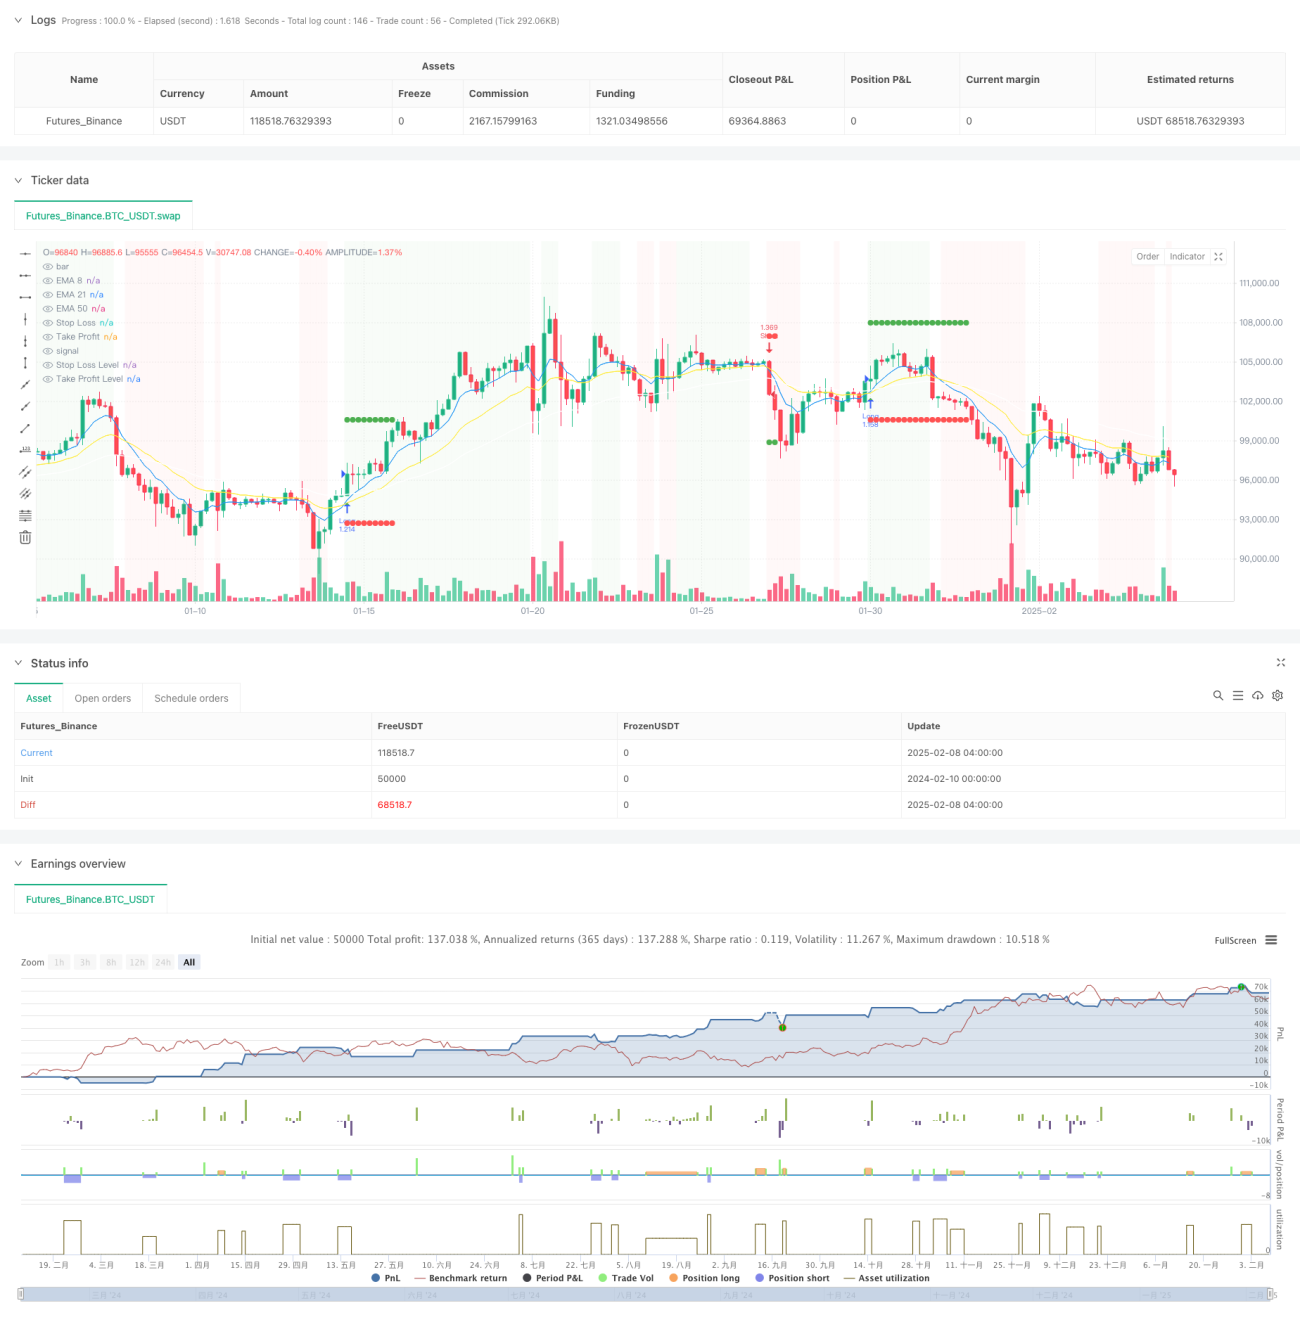
/*backtest
start: 2024-02-10 00:00:00
end: 2025-02-08 08:00:00
period: 4h
basePeriod: 4h
exchanges: [{"eid":"Futures_Binance","currency":"BTC_USDT"}]
*/

//@version=5
strategy("High Win-Rate Crypto Strategy with Drawdown Limit", overlay=true, initial_capital=10000, default_qty_type=strategy.fixed, process_orders_on_close=true)

// Moving Averages- 1